Figures & data
Figure 1. Thermodynamically calculated solubility limits of W in liquid Ni binder phase in Ti(C, N)-WC-50 wt.% Ni system incorporating different WC contents (from 5.0 wt.% to 20.0 wt.%) at 1450°C. The nominal concentration of W at each WC content is also given for reference.
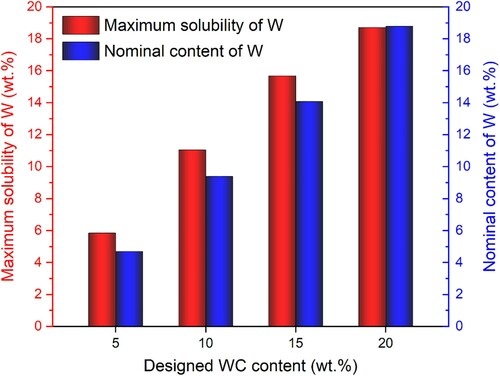
Figure 2. Scanning electron microscope (SEM) images of as-sintered Ti(C, N)-based cermets with different WC concentrations: (a) 5.0 wt.%, (b) 10.0 wt.%, (c) 15.0 wt.%, and (d) 20.0 wt.%. High-magnification images showing the details of microstructures in different regions from center to surface are also provided.
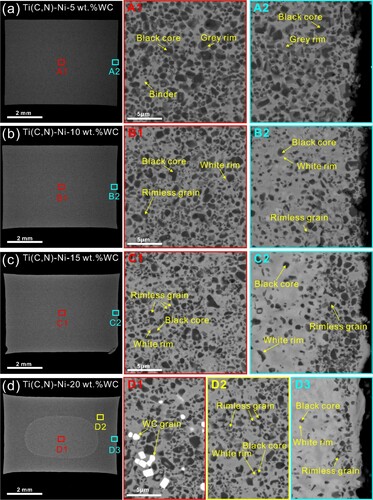
Figure 3. (a) N ion-current curve and thermogravimetric curve of Ti(C, N)-20 wt.% WC-50 wt.% Ni cermet in the temperature range of 1100–1450°C. (b) N distribution along with the increase of distance from the top surface to a depth of 200 μm. Enlarged views of N, Ti, W, and Ni distributions in the depth ranges of (c) 0–3 μm and (d) 3–40 μm. Note that the concentrations of N, Ti, W, and Ni in (c) were normalized after excluding the interference of C contamination on the cermet surface.
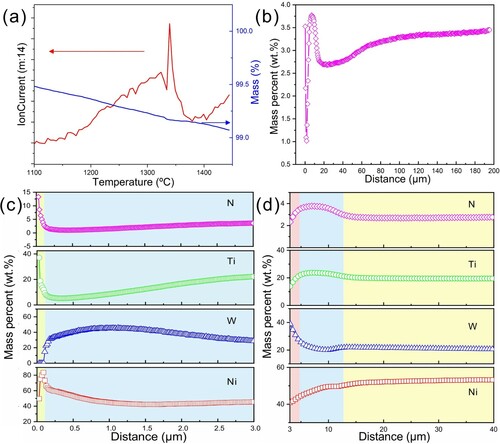
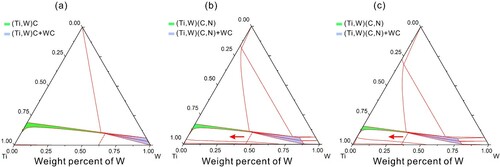
Figure 4. Isothermal sections of Ti-W-C system with different N additions at 1450°C: (a) Ti-W-C, (b) 3 wt.% N-Ti-W-C, (c) 5 wt.% N-Ti-W-C.