Figures & data

Figure 1. (a) Schematic illustration of the preparation of CeO2/NiFeP/NF. (b) SEM, (c) TEM, and (d) HRTEM images of CeO2/NiFeP. The inset of (c) shows a particle size distribution analysis. (e) XRD pattern of CeO2/NiFeP. (f) N2 adsorption/desorption isotherms and pore size distribution (the inset) of CeO2/NiFeP. (g) EPR spectra of CeO2/NiFeP and NiFeP.
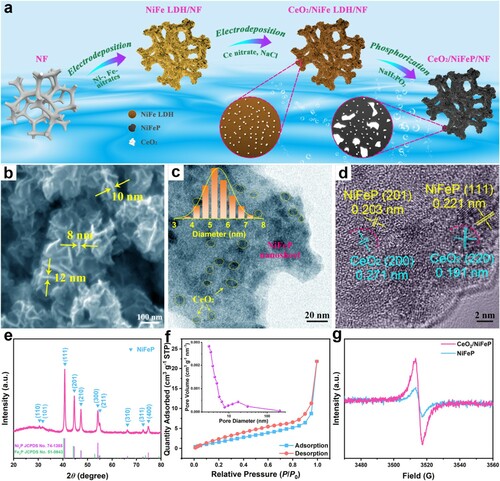
Figure 2. High-resolution XPS spectra of (a) Ni 2p, (b) Fe 2p, (c) Ce 3d, and (d) O 1s for CeO2/NiFeP/NF and NiFeP/NF.
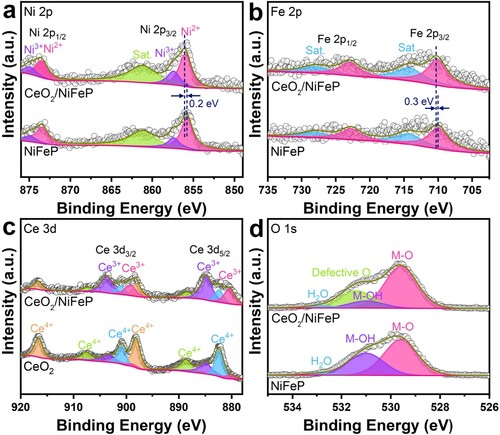
Figure 3. (a) Polarization curves of the CeO2/NiFeP/NF, NiFeP/NF, CeO2/NiFe LDH/NF, NiFe LDH/NF, RuO2/NF, and pure NF electrodes. (b) The corresponding Tafel plots. (c) Capacitive current densities at −0.25 V (vs. Hg/HgO) plotted against scan rates. (d) Chronopotentiometric test of the CeO2/NiFeP/NF electrode at a current density of 50 mA cm−2. The insets of (d) are SEM and TEM images of CeO2/NiFeP after the durability test. (e) Polarization curves of the CeO2/NiFeP/NF||CeO2/NiFeP/NF electrolyzer and the Pt/C/NF||RuO2/NF electrolyzer with a scan rate of 1 mV s–1 in 1 M KOH.
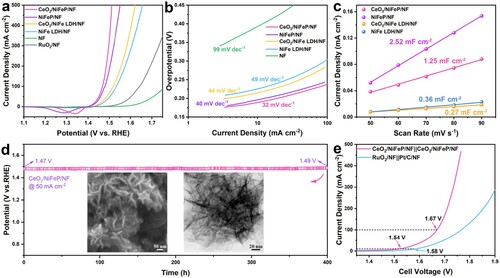
Figure 4. (a) XRD pattern of the post-OER sample. (b) EPR spectra of CeO2/NiFeP before and after the durability test. High-resolution XPS spectra of (c) Ce 3d, (d) O 1s, for the post-OER sample.
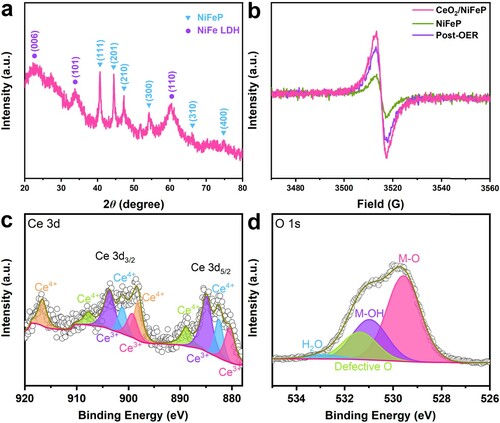
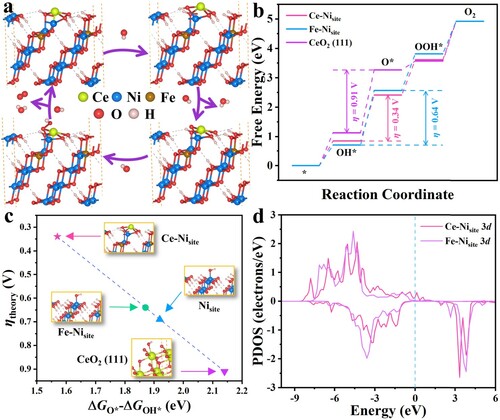
Figure 5. DFT simulation results. (a) Schematic profile of adsorption atomic configuration on the Ce–Nisite during the OER elementary steps. (b) Free energy diagrams along the reaction pathways on Ce–Nisite, Fe–Nisite and CeO2 (111) plane. (c) Representation of the theoretical overpotential as a function of the difference in O* and OH* adsorption Gibbs energies. (d) PDOS of Ce–Nisite 3d orbitals and Fe–Nisite 3d orbitals. The Fermi energy was set to zero.