Figures & data
Figure 1. (a) The low-magnification IPF map of HL-Mg-alloy; (b) The grain-size distribution in FG and CG layers. (c) The (0002) PFs of the FG and CG layers, respectively. (d) and (e) The IPF maps of as-rolled sample and as-annealed sample. (f) and (g) The high-magnification IPF and corresponding SEM microstructure of typical region. (h) and (i) TEM analysis showing Mg17Al12 particles mainly distributed along GBs of FGs.
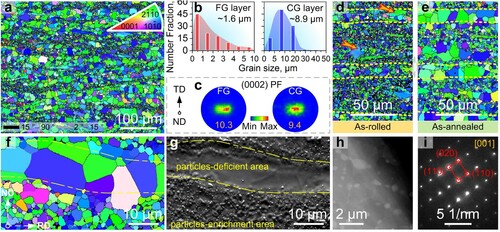
Figure 2. (a) Engineering stress–strain (σ–ϵ) curves of CG, FG and HL samples and LUR σ–ϵ curve of HL sample under tension along RD; the inset of a shows HDI-stress and HDI/strain-hardening curves of HL sample. (b) Comparison of yield strengths and fracture elongations of the present HL-Mg-alloy (indicated by star) with representative AZ91 Mg-alloys processed by accumulative rolling bonding (ARB) [Citation24,Citation25], equal channel angular process (ECAP) [Citation26–28], extrusion [Citation29–31], high-ratio differential speed rolling (HRDSR) [Citation6,Citation7], and wrought AZ80 [Citation4,Citation5,Citation32], AZ31 [Citation33–36], gradient-structured [Citation10–12] and bimodal-structured Mg-Al-Zn alloys [Citation19–21] reported in literature.
![Figure 2. (a) Engineering stress–strain (σ–ϵ) curves of CG, FG and HL samples and LUR σ–ϵ curve of HL sample under tension along RD; the inset of a shows HDI-stress and HDI/strain-hardening curves of HL sample. (b) Comparison of yield strengths and fracture elongations of the present HL-Mg-alloy (indicated by star) with representative AZ91 Mg-alloys processed by accumulative rolling bonding (ARB) [Citation24,Citation25], equal channel angular process (ECAP) [Citation26–28], extrusion [Citation29–31], high-ratio differential speed rolling (HRDSR) [Citation6,Citation7], and wrought AZ80 [Citation4,Citation5,Citation32], AZ31 [Citation33–36], gradient-structured [Citation10–12] and bimodal-structured Mg-Al-Zn alloys [Citation19–21] reported in literature.](/cms/asset/e431caa5-bebb-4168-99cd-6e1624e7a2d5/tmrl_a_2133976_f0002_oc.jpg)
Figure 3. (a) The IPF map, (b) scalar disclination density (in rad μm−2) and (c) scalar GND density (in μm−1) of the undeformed HL-Mg-alloy; (d) The IPF map, (e) scalar disclination density (in rad μm−2) and (f) scalar GND density (in μm−1) of the ∼3.5% strained HL-Mg-alloy.
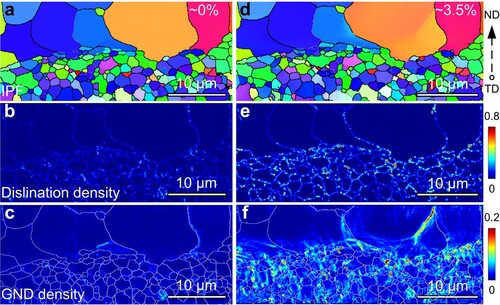
Figure 4. (a) The dark-field TEM image of typical FG after ∼13% tensile deformation under the two-beam condition of g = [].(b) The bright-field TEM image of region (b) in (a) using g = [
]; (c) the dark-field TEM image of region (c) in (a) using g = [
]. (d) The dark-field TEM image of typical FG after ∼23% tensile deformation using g = [
].
![Figure 4. (a) The dark-field TEM image of typical FG after ∼13% tensile deformation under the two-beam condition of g = [101¯0].(b) The bright-field TEM image of region (b) in (a) using g = [0002]; (c) the dark-field TEM image of region (c) in (a) using g = [0002]. (d) The dark-field TEM image of typical FG after ∼23% tensile deformation using g = [0002].](/cms/asset/929d66a3-ef41-4ff1-ae60-d739b780f995/tmrl_a_2133976_f0004_oc.jpg)
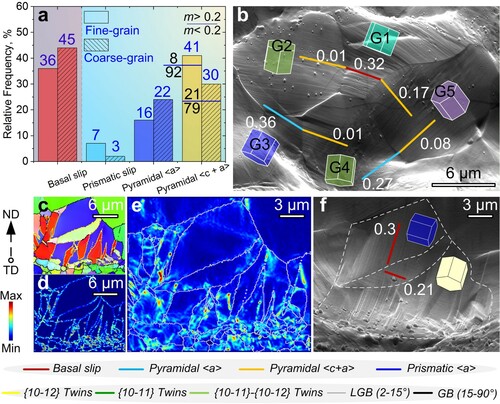
Figure 5. (a) The statistical results of the identified slip activity in CG and FG layers. Relative frequencies of activated pyramidal <c+a> slips with high m values (>0.2, above the blue line) and low m values (<0.2, below the blue line) are marked in (a). (b) The slip transfers in a typical region of CG layer. (c)–(f) The IPF, scalar disclination density (in rad µm−2), scalar GND density (in µm−1) and SEM of representative CG near hetero-interface, with feather-shaped tension twinning activated. The white numbers represent values (Schmid factor) under uniaxial loading.