Figures & data
Figure 1. Microstructure of the as-cast Nb2MoWC0.96 alloy. (a) XRD pattern and (b) SEM-BSE images show a fully eutectic microstructure. (c) HAADF-STEM image and the corresponding EDS maps show element distribution. (d) HADDF-STEM image of the eutectic structure. (e) HRTEM image of the BCC/NbC interface and the corresponding FFT patterns
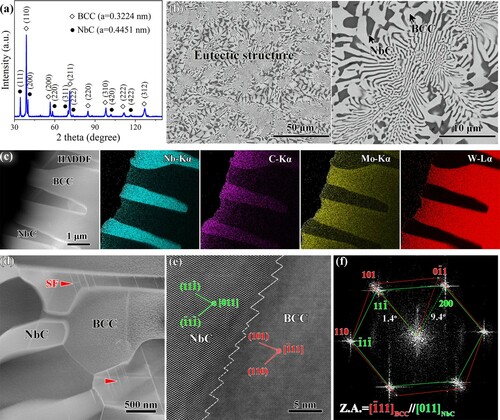
Table 1. Chemical composition of the phases measured by TEM-EDS.
Figure 2. (a) Calculated pseudo-binary phase diagram of Nb2MoWCx alloys. (b) XRD patterns of the as-cast and annealed Nb2MoWC0.96 samples. (c) SEM-BSE images of the as-cast and annealed Nb2MoWC0.96 samples.
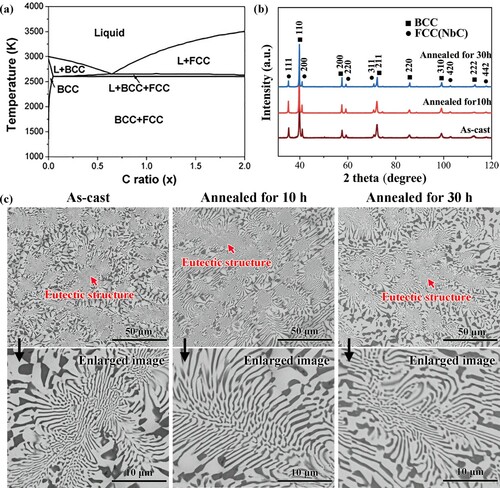
Figure 3. (a, b) Engineering and true stress-strain curves of the as-cast Nb2MoWC0.96 alloy at varying compression temperatures. (c-d) A comparison of specific strength and specific ultimate strength of the Nb2MoWC0.96 alloy with reported Nb and Nb-containing alloys [Citation13,Citation19-24].
![Figure 3. (a, b) Engineering and true stress-strain curves of the as-cast Nb2MoWC0.96 alloy at varying compression temperatures. (c-d) A comparison of specific strength and specific ultimate strength of the Nb2MoWC0.96 alloy with reported Nb and Nb-containing alloys [Citation13,Citation19-24].](/cms/asset/bb876f15-fda9-4deb-a31c-623d3cce5a34/tmrl_a_2133977_f0003_oc.jpg)
Table 2. Compressive properties of the as-cast Nb2MoWC0.96 alloy at varying temperatures.
Table 3. Calculated theoretical densities of various Nb and Nb-containing alloys.
Figure 4. EBSD maps of the as-cast and compressed Nb2MoWC0.96 alloy reveal the changes in the density of GNDs and orientation relationships between the BCC and NbC phases. (a) Phase maps, (b) IPF maps, (c) GND maps.
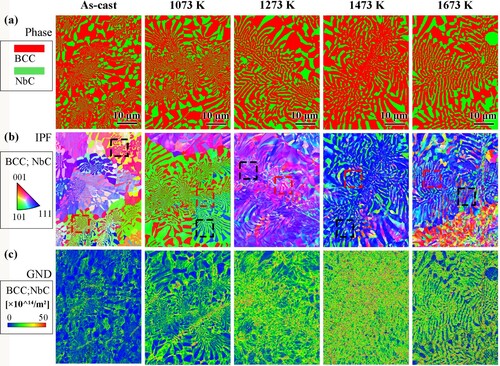
Table 4. GNDs of Nb and NbC in the as-cast and high compression temperatures.
Figure 5. EBSD pole figures of BCC and NbC phases from (a) whole area, (b) area 1 (black square), (c) area 2 (black square) of Figure (b).
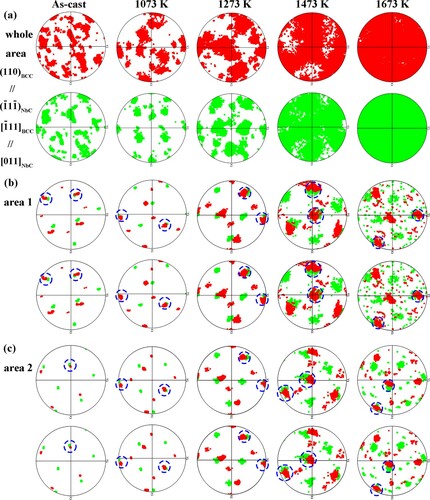
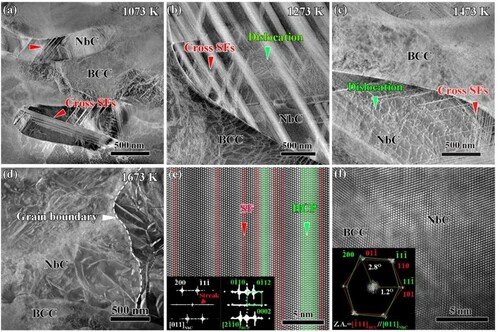
Figure 6. (a-d) HAADF-STEM images of the compressed Nb2MoWC0.96 alloy at varying temperatures. (e) atomic structure of stacking fault ribbons in the NbC phase. (f) HRTEM and the corresponding FFT patterns of the BCC/NbC phase interface.