Figures & data

Figure 1. HRTEM images of: (a) 1NC, (b) 2NC, (c) 1NG, and (d) 2NG.
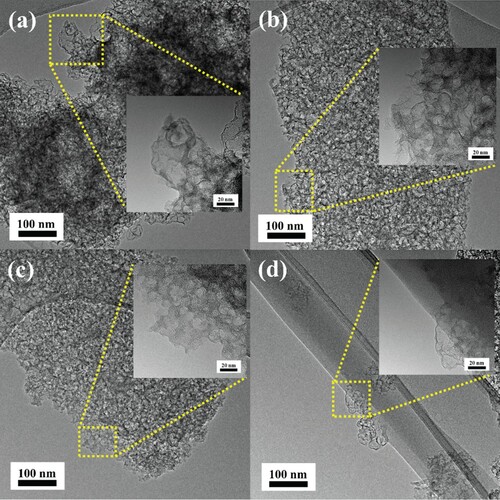
Figure 2. (a,b) Adsorption–desorption isotherms of N2 measured at −196°C on porous carbon materials. (c,d) Pore size distributions (PSDs) were obtained by the NLDFT method.
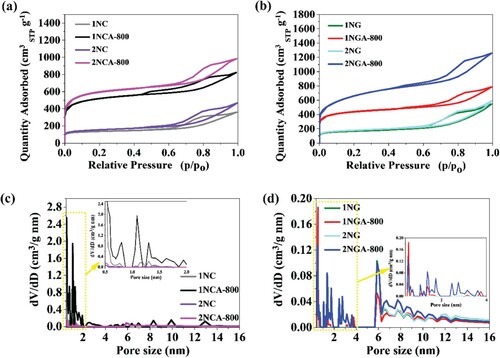
Figure 3. (a) Cyclic voltammetry curves recorded for carbon materials in 0.2 M K2SO4 (at a scan rate of v = 50 mV s−1) and (b) areal capacitance calculated on the basis of 100 galvanostatic charge/discharge cycles for carbon materials at a current density j = 3 mA cm−2.
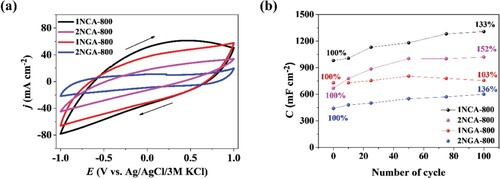
Figure 4. Specific capacitance plotted as a function of the number of GCD cycles for (a) 1NCA-800, (b) 2NCA-800, (c) 1NGA-800, and (d) 2NGA-800 (insets: GCD curves before and after charge/discharge tests recorded at a current density of 5 A g−1) measured in 0.2 M K2SO4 electrolyte.
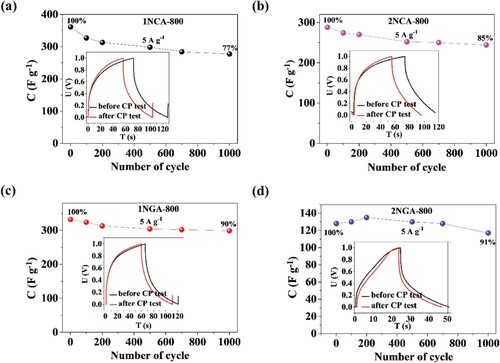
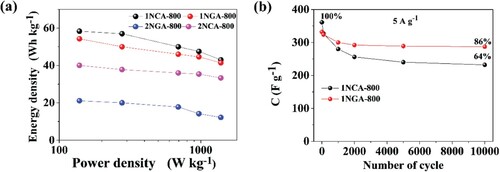
Figure 5. (a) Ragone plots for carbon materials in symmetric supercapacitors measured in 0.2 M K2SO4 electrolyte and (b) specific capacitance plotted as a function of the number of GCD cycles of 1NCA-800 and 1NGA-800 for 10,000 cycles.