
Figures & data
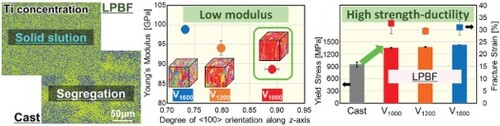
Figure 1. Powder and LPBF-built Ti28.33Zr28.33Hf28.33Nb6.74Ta6.74Mo1.55 BioHEA. (a) SEM image of gas-atomised powder and (b) appearance of LPBF-built jungle gym-shaped product.
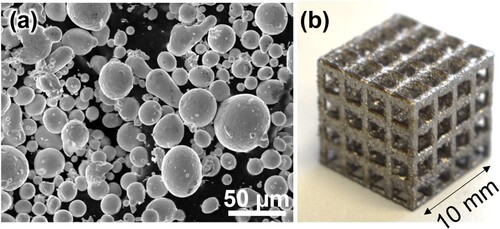
Table 1. Overall compositions (at. %) of powder, cast and LPBF-fabricated specimens.
Figure 2. Compositional distribution analyses. BSE images and EDS maps for Ti, Zr, and Ta of (a) LPBF-built and (b) cast Ti28.33Zr28.33Hf28.33Nb6.74Ta6.74Mo1.55 BioHEA specimen. (c) Concentrations of constituent elements in the dendrite and inter-dendrite regions of the cast specimen and LPBF specimen determined by EDS. *: P < 0.05.
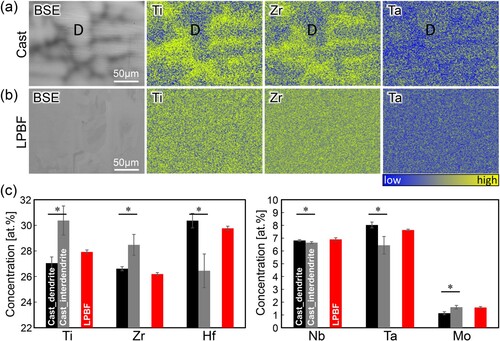
Figure 3. Crystallographic texture of the LPBF-built specimens. (a) Inverse pole figure maps taken in the orthogonal three planes and (b) the corresponding 001 pole figures. (c) Quantified degree of <001>crystallographic orientation along z-axis. *: P < 0.05.
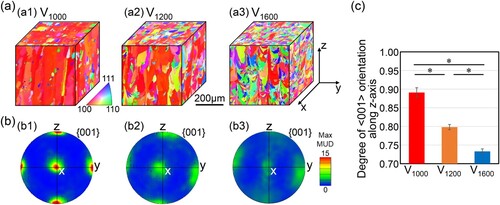
Figure 4. Mechanical properties of the BioHEA: (a) Yield stress and fracture strain and (b) Young’s modulus of the cast and LPBF-built Ti28.33Zr28.33Hf28.33Nb6.74Ta6.74Mo1.55 BioHEA specimen; *: P < 0.05 by Tukey’s test; a: P < 0.05 vs cast; b: P < 0.05 vs V1600 by t-test.
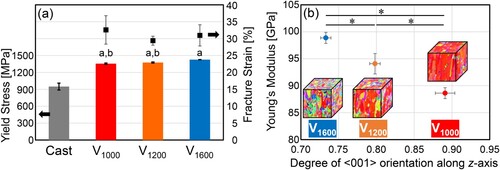
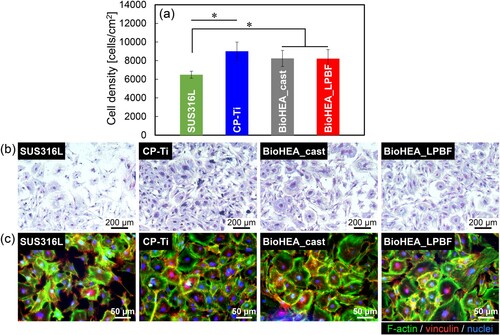
Figure 5. Biocompatibility of LPBF-fabricated Ti28.33Zr28.33Hf28.33Nb6.74Ta6.74Mo1.55 BioHEA in comparison with cast specimen, CP-Ti, and SUS316L. (a) Quantitative analysis of cell density; *: P < 0.05. (b) Giemsa and (c) fluorescent staining images of osteoblasts adhesion on the specimens.
Data availability statement
Data will be made available on request.