
Figures & data
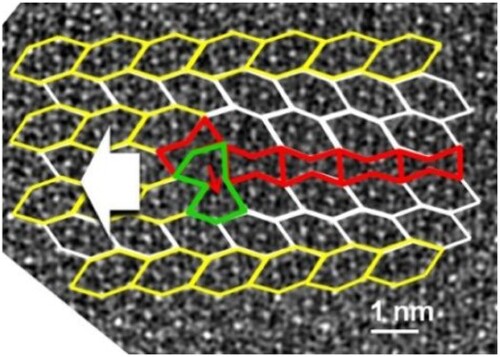
Figure 1. Bragg-contrast TEM still images of an in-situ heating experiment at 645°C showing the motion of dislocations (red arrows) trailing planar defects. The movement of the dislocations is determined by comparison of their relative positions with respect to the surface contamination speckles (blue arrows). In the 60s frame, the dislocation positions at t = 0 s are indicated by pink arrows as a guide to the eye.
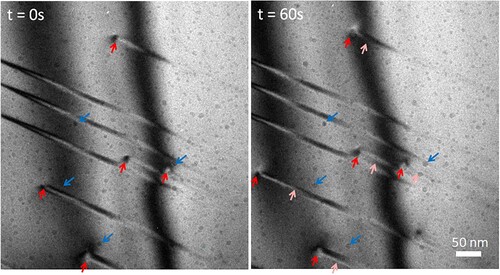
Figure 2. (a,b) High-resolution transmission electron micrograph still images of in-situ heating experiments at 565°C showing the motion of a dislocation (red arrows) along the -[0 0 1] and -[1 0 1] direction trailing planar defect segments. Previous dislocation positions are indicated by pink arrows. See supplementary movie 2 and crystallographic information in Figure S4.
![Figure 2. (a,b) High-resolution transmission electron micrograph still images of in-situ heating experiments at 565°C showing the motion of a dislocation (red arrows) along the -[0 0 1] and -[1 0 1] direction trailing planar defect segments. Previous dislocation positions are indicated by pink arrows. See supplementary movie 2 and crystallographic information in Figure S4.](/cms/asset/11bcdd35-1126-4e41-a338-4d7f8b8c7fc2/tmrl_a_2155492_f0002_oc.jpg)
Figure 3. (a) HAADF-STEM micrograph a dislocation associated with a (1 0 0) planar defect and corresponding tiling representation. (b) Burgers circuit around the dislocation core using unstrained tiles. The Burgers vector is represented by a red arrow. (c) HAADF-STEM micrograph of a (1 0 1) planar defect.
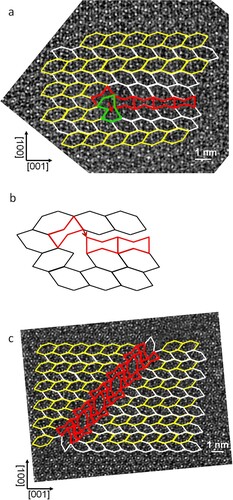
Figure 4. (a) Tiling model of a dislocation trailing a (1 0 0) planar defect and sequence of motion along a -[0 0 1] direction (b) and along a -[1 0 1] direction. (d1, d2) Further motion along -[0 0 1] direction and -[1 0 1], respectively.
![Figure 4. (a) Tiling model of a dislocation trailing a (1 0 0) planar defect and sequence of motion along a -[0 0 1] direction (b) and along a -[1 0 1] direction. (d1, d2) Further motion along -[0 0 1] direction and -[1 0 1], respectively.](/cms/asset/bc8930e4-a16d-4adc-b8cb-2a935e409b52/tmrl_a_2155492_f0004_oc.jpg)