
Figures & data
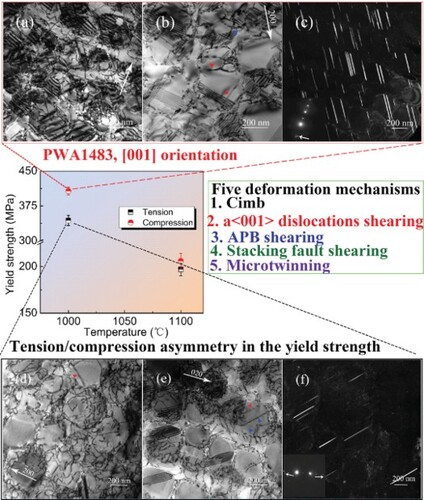
Figure 1. (a) Bright-field (BF) TEM image illustrating the γ/γ′ microstructure in PWA1483 after SHT; (b) HAADF image displaying the γ′ precipitates in PWA1483 after SHT; (c) typical engineering stress-strain curves of the [001]-orientated SC nickel-based superalloy PWA1483 in compression and tension at high temperatures; (d) tensile and compressive yield strength at 1000 and 1100 °C. With respect to the compressive stress-strain curves, the extensometer was not used during the tests. The crosses manifest that compression tests are broken off.
![Figure 1. (a) Bright-field (BF) TEM image illustrating the γ/γ′ microstructure in PWA1483 after SHT; (b) HAADF image displaying the γ′ precipitates in PWA1483 after SHT; (c) typical engineering stress-strain curves of the [001]-orientated SC nickel-based superalloy PWA1483 in compression and tension at high temperatures; (d) tensile and compressive yield strength at 1000 and 1100 °C. With respect to the compressive stress-strain curves, the extensometer was not used during the tests. The crosses manifest that compression tests are broken off.](/cms/asset/4d212a74-80a6-449f-8fe4-39caaec3006c/tmrl_a_2166432_f0001_oc.jpg)
Figure 2. TEM images showing the typical microstructures in PWA1483 after around 2.0% compressive plastic strain at 1000 °C ((a)-(c)) and 1100 °C ((d)-(f)): (a) zig-zag and curve dislocations as well as isolated SSFs, g = BF; (b) isolated SSFs, pairs of a/2 < 110 > dislocations and a < 001 > superdislocations, g = (200)BF; (c) MTs, DF image; (d) zig-zag and curve dislocations as well as pairs of a/2 < 110 > dislocations, g = (200)BF; (e) isolated SSFs and a < 001 > superdislocations, g =
BF; (f) MTs, DF image. The red arrowheads and blue triangles indicate the a < 001 > superdislocations and pairs of a/2 < 110 > dislocations, respectively. The while arrow indicates the spots of MTs within the diffraction pattern of the [011] zone axis.
![Figure 2. TEM images showing the typical microstructures in PWA1483 after around 2.0% compressive plastic strain at 1000 °C ((a)-(c)) and 1100 °C ((d)-(f)): (a) zig-zag and curve dislocations as well as isolated SSFs, g = (2¯00)BF; (b) isolated SSFs, pairs of a/2 < 110 > dislocations and a < 001 > superdislocations, g = (200)BF; (c) MTs, DF image; (d) zig-zag and curve dislocations as well as pairs of a/2 < 110 > dislocations, g = (200)BF; (e) isolated SSFs and a < 001 > superdislocations, g = (2¯00)BF; (f) MTs, DF image. The red arrowheads and blue triangles indicate the a < 001 > superdislocations and pairs of a/2 < 110 > dislocations, respectively. The while arrow indicates the spots of MTs within the diffraction pattern of the [011] zone axis.](/cms/asset/0838f602-e90a-4257-921e-a85845746e4d/tmrl_a_2166432_f0002_ob.jpg)
Figure 3. TEM images showing the typical microstructures in PWA1483 after around 2.0% tensile plastic strain at 1000 °C ((a)-(c)) and 1100 °C ((d)-(f)): (a)zig-zag and curve dislocations as well as a < 001 > superdislocations, BF image, g = BF; (b) isolated SSFs, pairs of a/2 < 110 > dislocations and a < 001 > superdislocations, g = (020)BF; (c) MTs, DF image; (d) zig-zag and curve dislocations, isolated SSFs and pairs of a/2 < 110 > dislocations, g = (200)BF; (e) pairs of a/2 < 110 > dislocations and a < 001 > superdislocations, g = (200)BF; (f) MTs, DF image. The red arrowheads and blue triangles indicate the a < 001 > superdislocations and pairs of a/2 < 110 > dislocations, respectively. The while arrow indicates the spots of MTs within the diffraction pattern of the [011] zone axis.
![Figure 3. TEM images showing the typical microstructures in PWA1483 after around 2.0% tensile plastic strain at 1000 °C ((a)-(c)) and 1100 °C ((d)-(f)): (a)zig-zag and curve dislocations as well as a < 001 > superdislocations, BF image, g = (2¯00)BF; (b) isolated SSFs, pairs of a/2 < 110 > dislocations and a < 001 > superdislocations, g = (020)BF; (c) MTs, DF image; (d) zig-zag and curve dislocations, isolated SSFs and pairs of a/2 < 110 > dislocations, g = (200)BF; (e) pairs of a/2 < 110 > dislocations and a < 001 > superdislocations, g = (200)BF; (f) MTs, DF image. The red arrowheads and blue triangles indicate the a < 001 > superdislocations and pairs of a/2 < 110 > dislocations, respectively. The while arrow indicates the spots of MTs within the diffraction pattern of the [011] zone axis.](/cms/asset/81135a59-cbf8-4e87-a15d-23468f8e81b4/tmrl_a_2166432_f0003_ob.jpg)
Figure 4. (a) HRTEM micrograph showing the formation of MTs in PWA1483 after around 2.0% compressive plastic strain at 1000 °C (Using the HRTEM filter script developed by Mitchell to filter the HRTEM image based on the work of Kilaas [Citation45]); (b) CDF image showing one SSF, g = (020); (c) BF image illustrating the invisibility of the SSF with the reflection .
![Figure 4. (a) HRTEM micrograph showing the formation of MTs in PWA1483 after around 2.0% compressive plastic strain at 1000 °C (Using the HRTEM filter script developed by Mitchell to filter the HRTEM image based on the work of Kilaas [Citation45]); (b) CDF image showing one SSF, g = (020); (c) BF image illustrating the invisibility of the SSF with the reflection (22¯0).](/cms/asset/dbb745b8-c03c-45e1-860e-38e014fe6c87/tmrl_a_2166432_f0004_ob.jpg)