Figures & data

Figure 1. Tensile properties and fracture morphology of LMs with various LS at 750°C: (a) Tensile true strain–stress curves; (b) Comparison of strength and ductility between the designed TNM alloy with LM3 structure and other alloys used at elevated temperature, including TiAl alloys, Ni-based, Co-based and TMW superalloys [Citation18–35]. (c) Work-hardening rate curves. (d) and (e) fracture morphology of LM1 and LM3, respectively.
![Figure 1. Tensile properties and fracture morphology of LMs with various LS at 750°C: (a) Tensile true strain–stress curves; (b) Comparison of strength and ductility between the designed TNM alloy with LM3 structure and other alloys used at elevated temperature, including TiAl alloys, Ni-based, Co-based and TMW superalloys [Citation18–35]. (c) Work-hardening rate curves. (d) and (e) fracture morphology of LM1 and LM3, respectively.](/cms/asset/ca17d2a6-4248-4193-acb0-69574935d93b/tmrl_a_2173537_f0001_oc.jpg)
Figure 2. Microstructural details of LM1 and LM3: (a) and (b) Euler orientation maps superimposed on the BC images of two LMs, where all results are attained with a step size of 0.15 µm; The Euler angle-based color scale attached in (b) shows that similar colors indicate similar orientations; (c) and (d) BF-TEM images of LM1 and LM3, where the insets show SAED patterns, elaborating Blackburn orientation relationship between α2/γ lamellae and γ twin symmetry.
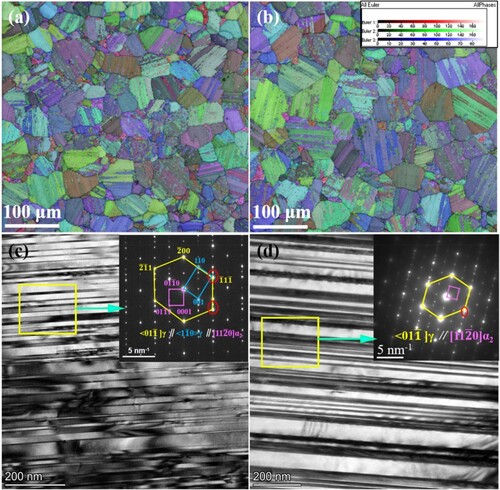
Figure 3. Deformation mechanism of LM1: (a) BF-TEM image indicates that dislocations and twins do not develop during the tensile process; (b) HRTEM image of deformed LM1; and (c) high-magnification HRTEM images of (b) Area-A and (d) Area-B.
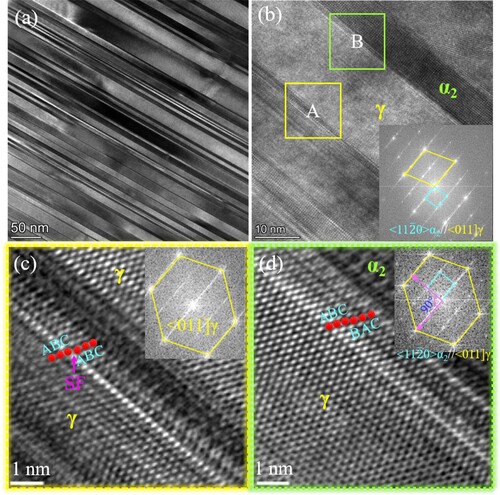
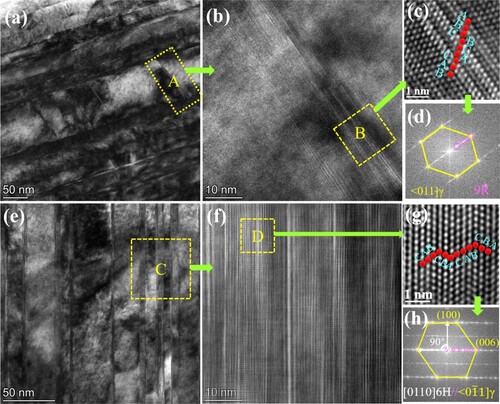
Figure 4. Deformation mechanism of LM3: (a) BF-TEM image exhibits fine bundles perpendicular to the lamellar interface; (b) HRTEM image of the Area-A in (a); (c) high-magnification HRTEM image of the Area-B indicates a 9R stacking sequence; (d) FFT pattern of (b); (e) BF-TEM image shows the deformed microstructure of HT3-ed alloys without dislocations or twins; (f) HRTEM shows the multiple nanometer-sized LPSO bands; (g) high-magnification HRTEM image of the Area-B revealing a 6H-LPSO stacking sequence; and (h) FFT pattern reveals 6H-LPSO diffraction spots.