Figures & data

Figure 1. The microstructure and mechanical properties of the Al strip used in this work: (a) and (b) the full-thickness EBSD IPF map in ND and RD, respectively; (c) and (d) the ODF sections ( = 0°, 45°, 65°) for the surface region and the center region, respectively; (e) the variation in the volume fraction of texture components along ND; (f) engineering stress-strain curves along RD; (g) elongation data correction to rule out the specimen geometry effect on ductility. (h) Ashby map comparing the tensile property improvement conferred by the texture gradient (this work) and the gradient in other microstructural features. These include laminates with different grain sizes [Citation32,Citation33], laminates with different compositions and grain sizes [Citation34–37], gradient in grain size [Citation6,Citation7,Citation17,Citation38,Citation39,Citation40]; gradient in grain size and twin fraction/thickness [Citation5,Citation11]. In (g),
,
, and
represent the gauge length, width, and thickness of the tensile specimen, respectively. The upper bound and lower bound of the n value (−0.2 and −0.3) are determined based on Al-Mn plates with homogeneous microstructures (Figure S2 in Supplementary Materials). In (h), the gradient/laminate materials’ UTS are normalized by the UTS of the ‘hard phase’. The total elongation of the gradient/laminate materials is normalized by the total elongation of the ‘soft/ductile phase’.
![Figure 1. The microstructure and mechanical properties of the Al strip used in this work: (a) and (b) the full-thickness EBSD IPF map in ND and RD, respectively; (c) and (d) the ODF sections (φ2 = 0°, 45°, 65°) for the surface region and the center region, respectively; (e) the variation in the volume fraction of texture components along ND; (f) engineering stress-strain curves along RD; (g) elongation data correction to rule out the specimen geometry effect on ductility. (h) Ashby map comparing the tensile property improvement conferred by the texture gradient (this work) and the gradient in other microstructural features. These include laminates with different grain sizes [Citation32,Citation33], laminates with different compositions and grain sizes [Citation34–37], gradient in grain size [Citation6,Citation7,Citation17,Citation38,Citation39,Citation40]; gradient in grain size and twin fraction/thickness [Citation5,Citation11]. In (g), l0, w0, and t0 represent the gauge length, width, and thickness of the tensile specimen, respectively. The upper bound and lower bound of the n value (−0.2 and −0.3) are determined based on Al-Mn plates with homogeneous microstructures (Figure S2 in Supplementary Materials). In (h), the gradient/laminate materials’ UTS are normalized by the UTS of the ‘hard phase’. The total elongation of the gradient/laminate materials is normalized by the total elongation of the ‘soft/ductile phase’.](/cms/asset/64a76013-c8c2-422c-b0b6-9e97d96747c2/tmrl_a_2178861_f0001_oc.jpg)
Table 1. Tensile properties of the full-thickness strip and the free-standing layers.
Figure 2. Typical area tracked in the surface region: (a) EBSD RD-IPF map at = 0; (b) EBSD RD-IPF map at
= 0.16; (c) surface morphology under SEM (mosaic of ∼150 SEM images with an overlap of ∼25%); (d) magnified SEM image showing planar slip traces at
= 0.16 in the area highlighted by the white rectangles in (a) and (b); (e) planar slip traces in a representative grain; (f) dislocation image under TEM, zone axis
,
; (g) Statistics on grain rotation angles during tension (from
= 0 to
= 0.16). The blue line and the red arrow in (e) represent the calculated slip trace and the slip direction. The Schmid factors (SF) of the slip systems are given under the corresponding cubes.
![Figure 2. Typical area tracked in the surface region: (a) EBSD RD-IPF map at ϵp = 0; (b) EBSD RD-IPF map at ϵp = 0.16; (c) surface morphology under SEM (mosaic of ∼150 SEM images with an overlap of ∼25%); (d) magnified SEM image showing planar slip traces at ϵp = 0.16 in the area highlighted by the white rectangles in (a) and (b); (e) planar slip traces in a representative grain; (f) dislocation image under TEM, zone axis ≈[110], g=[1¯11¯]; (g) Statistics on grain rotation angles during tension (from ϵp = 0 to ϵp = 0.16). The blue line and the red arrow in (e) represent the calculated slip trace and the slip direction. The Schmid factors (SF) of the slip systems are given under the corresponding cubes.](/cms/asset/641b4dc9-b5ee-490b-b746-0b617a23ce96/tmrl_a_2178861_f0002_oc.jpg)
Figure 3. Typical area tracked in the center region: (a) EBSD RD-IPF map at = 0; (b) EBSD RD-IPF map at
= 0.16; (c) surface morphology under SEM (mosaic of ∼150 SEM images with an overlap of ∼25%); (d) magnified SEM image showing wavy slip traces at
= 0.16 in the area highlighted by the white rectangles in (a) and (b); (e) wavy slip traces in a representative grain; (f) dislocation image under TEM, zone axis
,
; (g) Statistics on grain rotation angles during tension (from
= 0 to
= 0.16).
![Figure 3. Typical area tracked in the center region: (a) EBSD RD-IPF map at ϵp = 0; (b) EBSD RD-IPF map at ϵp = 0.16; (c) surface morphology under SEM (mosaic of ∼150 SEM images with an overlap of ∼25%); (d) magnified SEM image showing wavy slip traces at ϵp = 0.16 in the area highlighted by the white rectangles in (a) and (b); (e) wavy slip traces in a representative grain; (f) dislocation image under TEM, zone axis ≈[110], g=[1¯11¯]; (g) Statistics on grain rotation angles during tension (from ϵp = 0 to ϵp = 0.16).](/cms/asset/77c98aae-2843-4cc1-a274-6fa176e787ac/tmrl_a_2178861_f0003_oc.jpg)
Figure 4. Analysis of the distinct deformation mechanisms in the surface region and the center region: (a) and (b) the correlation between the slip characteristics, the factor , and the grain orientation; (c) and (d) the correlation between the rotation angle and the grain orientation. (a) and (c) correspond to the surface region, (b) and (d) the center region. Note that (a) and (b) were plotted based on the orientations and slip characteristics of the tracked grains determined experimentally. For clarity, the grains showing mixed slip patterns are included in the bar chats but not in the IPFs. (c) and (d) were plotted based on crystal plasticity modeling considering 10,000 grains generated from the measured ODFs. For easy comparison, the grain rotation angles measured experimentally were also included in the bar charts.
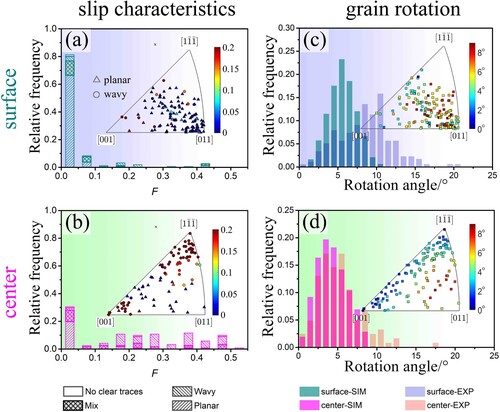
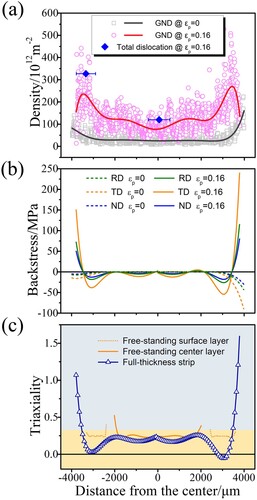
Figure 5. The influence of the texture-gradient-induced heterogeneous deformation on the ductility of the strip: (a) GND density distribution along ND (measured by EBSD); (b) backstress distribution along ND; (c) local triaxiality distribution along ND. The total dislocation densities (measured by synchrotron XRD) at different depths of the strip are included in (a) for reference.