Figures & data

Figure 1. Electrochemical performance and microstructure characterizations. The LCO/Li-metal half-cell is cycled at 0.2 C rate (1C = 140 mA g−1) in the voltage window 2.7–4.2 V. (a) Capacity retention and corresponding columbic efficiencies. (b) The corresponding charge/discharge voltage profiles, showing only capacity decay is significant (highlighted by the red arrow). (c) STEM-HAADF image to show a LiCoO2 particle after 500 cycles. Many cracks are formed in the SPTL highlighted by yellow arrows. Inset diffraction pattern is from the grain bulk, showing the well-preserved layered structure. (d) The lattice image from the blue area in (c), reveals the well-defined layered structure in the bulk. (e) Enlarged image from the red area in (c) to show the defective SPTL with high density of cracks and voids (dark contrast).
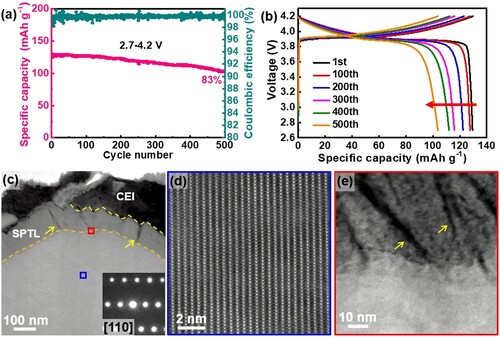
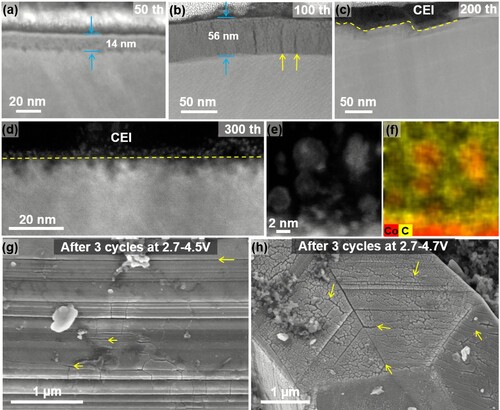
Figure 2. Surface cracking and exfoliation process. (a–c) STEM-HAADF images show the SPTL thickness after different cycle numbers. The vertical cracks (yellow arrows) are formed in (b) after 100 cycles. The interfacial cracks (red arrows) are formed after more cycles in (c, d). (d, e) STEM-HAADF images of LiCoO2 particle after 1000 cycles, showing the SPTL are exfoliated. The SPTL shows gray contrast on the LCO surface. Completely exfoliated SPTL is highlighted by the dashed yellow lines. (f) Schematic diagrams to illustrate the surface layer exfoliation process during the cycling of LiCoO2.
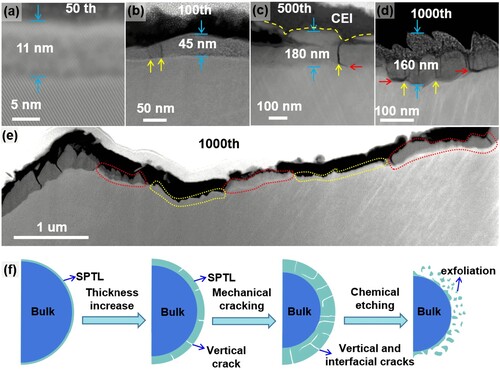
Figure 3. Misfit-strain induced surface crack. (a–c) STEM-HAADF images of a LiCoO2 particle after 300 cycles. High-resolution lattice images from (b) the LCO substrate and (c) the SPTL, where the plane spacing of layered (003) is 4.73 Å and that of spinel SPTL (111) planes is 4.67 Å. (d) A film-substrate model to show the crack generation in the SPTL under tensile stress. Enlarged interfacial lattice structure model shows the misfit strain between delithiated LCO and SPTL.
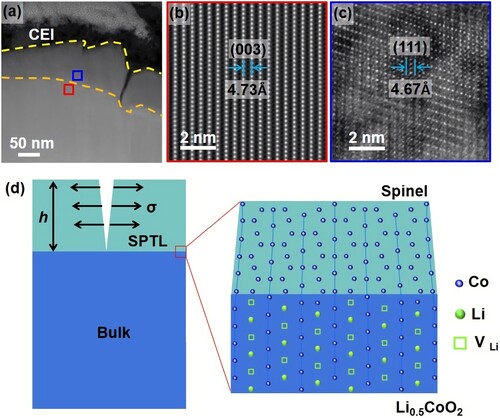
Figure 4. Simulation of the crack propagation. The evolutions of dimensionless hydrostatic stress and the set surface crack at different dimensionless times t* = 0, t* = 4000, t* = 8000 and t* = 12000. (a) Thin SPTL model. When the SPTL thickness as 90 nm, the crack propagates vertically to the bulk/SPTL interface. (b) Thick SPTL model. The crack grows vertically and then bent to interfacial at the bulk/SPTL interface.
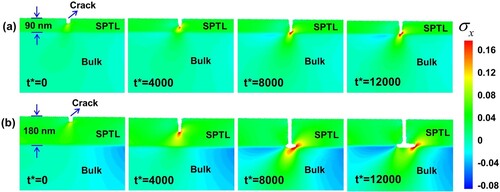
Figure 5. Evolution of the SPTL when cycled at 2.7–4.4 V. (a–d) STEM-HAADF images to show the thickness of the SPTL when cycled at 2.7–4.4 V at different cycle numbers. The SPTL exfoliation is observed in (c, d). (e, f) EDS-mapping images show the fragmented pieces near the surface of bulk including Co elements and strong C signal, indicating that the SPTL fragments are entrapped in the CEI layer. (g–h) SEM images to show the massive cracks formed on the surface of LiCoO2 particle cycled at higher voltages, 4.5 and 4.7 V respectively.