Figures & data

Figure 1. (a) Tensile engineering stress–strain curves at different temperatures, the insert depicts the size of tensile samples. (b) comparison of strength and ductility between our prepared WY alloy and W foils, deformed pure W or tungsten alloys at 200 °C.
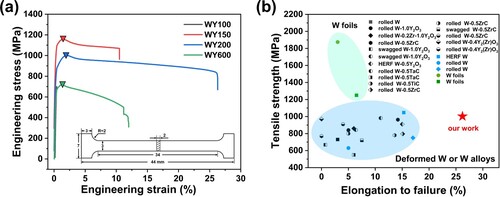
Figure 2. (a) The SEM image of hot-rolled WY alloy along RD-ND surface. SEM images of tensile fracture surfaces at (b) 100 °C, (c) 150 °C, (d) 200 °C, (e, f) 600 °C, and (f) is along RD-ND surface. RD, ND denote rolling and normal direction, respectively.
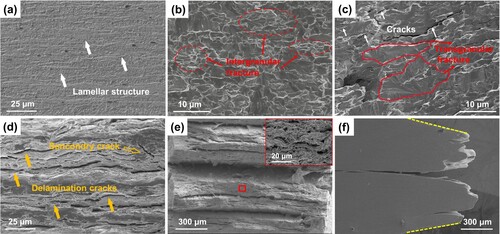
Figure 3. EBSD characterization of the present WY alloy. (a) grain map, (b) inverse pole figure (IPF) map, (c) image quality (IQ) map with superimposed grain boundaries, (d) kernel average misorientation (KAM) map, (e) grain size distribution and (f) grain boundary misorientation distribution map. TD denote transverse direction. The black particles in the figure indicate the doped second phase.
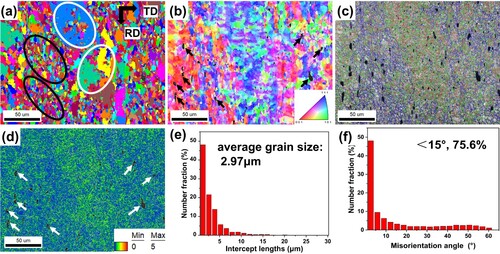
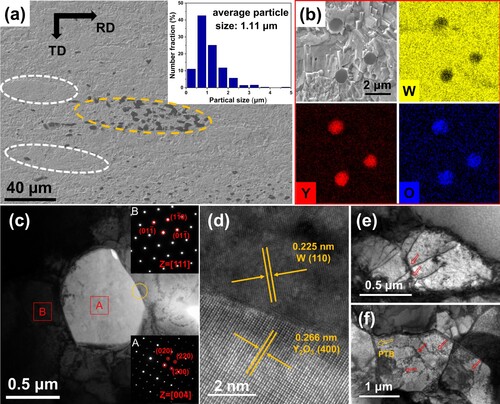
Figure 4. (a) Distribution of oxide particles, the inset is the particle size distribution statistics, (b) EDS spectrum of oxide particles, including W, Y and O elements, (c) TEM image and the corresponding SAED patterns of oxide particle (marked with A) and W matrix (marked with B), (d) HRTEM image of the interface between matrix and particle (yellow circle in c), (e, f) tangled dislocations denoted by red arrows.