Figures & data
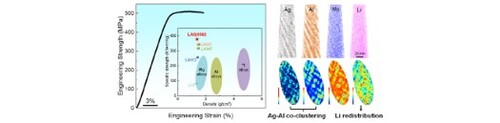
Figure 1. (a) Mechanical property and (b) XRD profile of the experimental Mg-Li-Al-Ag alloy. The inset in (a) shows the relation between specific strength and density of LAQ1562 with some high strength BCC Mg-Li-Al alloys [Citation9,Citation10,Citation19,Citation21] and conventional lightweight (Mg, Al, Ti) alloys. All the mechanical property results are obtained from macrosize samples.
![Figure 1. (a) Mechanical property and (b) XRD profile of the experimental Mg-Li-Al-Ag alloy. The inset in (a) shows the relation between specific strength and density of LAQ1562 with some high strength BCC Mg-Li-Al alloys [Citation9,Citation10,Citation19,Citation21] and conventional lightweight (Mg, Al, Ti) alloys. All the mechanical property results are obtained from macrosize samples.](/cms/asset/49759670-5f1f-41f9-86a1-7f23a1fa5b48/tmrl_a_2188909_f0001_oc.jpg)
Figure 2. (a) HAADF-STEM image and corresponding EDS mapping of (b) Mg, (c) Ag, (d) Al in the Mg-Li-Al-Ag alloy.
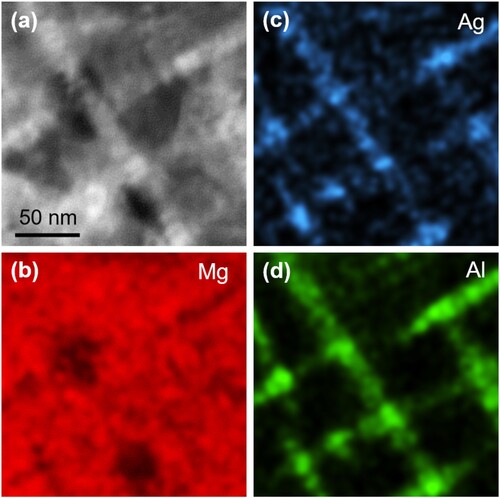
Figure 3. APT reconstruction of Mg-Li-Al-Ag alloy showing (a) Ag, (b) Al, (c) Mg and (d) Li ions distributions; (a1–d1) 2D atomic density contour maps of Ag, Al, Mg and Li ions projected from a 60 nm × 120 nm × 8 nm volume marked by the red dashed rectangle in (a). The black dashed circles in (b1) represent the core of some Al-Ag co-clusters and the ones in (d1) correspond to the identical positions in (b1).
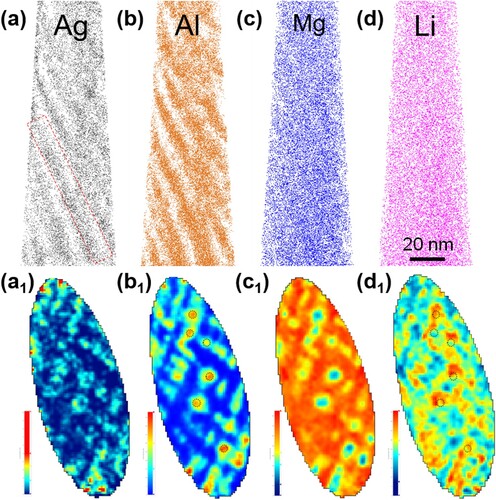
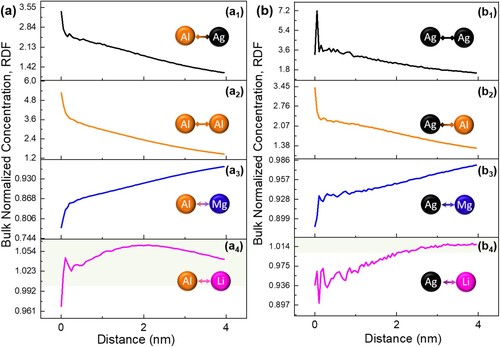
Figure 4. (a) APT reconstruction exhibiting 10 at.% Al iso-composition surface; (b) 1D concentration profile obtained perpendicular to the modulated clusters in Mg-Li-Al-Ag alloy. The Al-Ag co-clusters are shaded by light yellow. Typical region of elemental Li enrichment around Al-Ag co-clusters are marked by pink arrows; (c) Experimental bulk normalized concentration radial distribution functions (RDFs) of Li with Li.
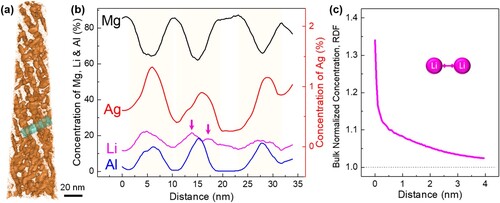
Figure 5. Experimental bulk normalized radial distribution functions (RDFs) of (a) Al and (b) Ag with Ag, Al, Mg and Li, indicating a compositional segregation in Mg-Li-Al-Ag alloy. The regions with the value of the bulk normalized concentration larger than unity is shaded by light green in (a4) and (b4).