
Figures & data
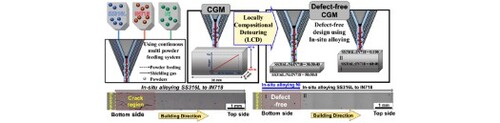
Figure 1. (a) Schematic of the DED process for CGM fabrication; (b) OM, (c) SEM, (d) EDS line profile, and (e) estimated concentration ratio of SS316L and IN718 CGM fabricated using the DED process. In this study, the longitudinal direction is denoted as X, the transverse direction is denoted as Y, and the fabrication direction is denoted as Z.
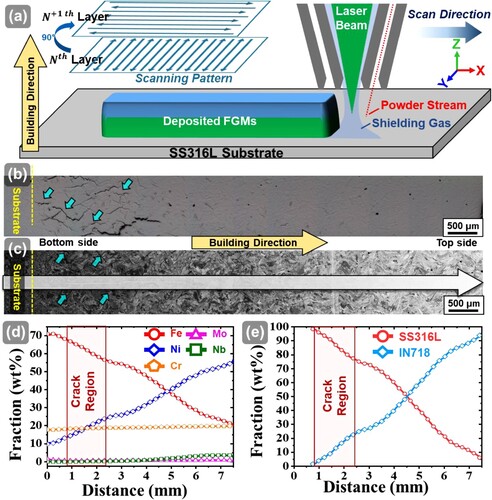
Figure 2. SEM micrographs obtained from the crack region at various magnifications: (a) the crack zone cracks are indicated by white arrows, building direction are indicated by yellow arrows, (b) cell structure and secondary phases, (c) SEM and EDS results obtained at high magnification. (d) XRD pattern of the CGM fabricated by the DED process and (e) a resized XRD pattern to clearly show secondary phases.
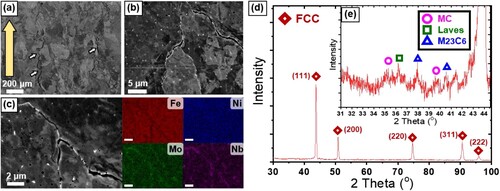
Figure 3. (a) Equilibrium phase fraction with temperature for a wt% ratio 88:12 (SS316L:IN718), (b) the magnified view of (a) to clearly show minor phases, (c) CCT curves as a function of time and temperature for a wt% concentration ratio of 88:12 (SS316L:IN718) and (e) fraction of secondary phases to Ni concentration considering the temperature of the CGM fabricated by the DED process.
Figure 4. SEM-EBSD maps of crack zones: (a) SEM micrograph showing cracks in the composition range between (SS316L ∼2 to ∼24 wt%), with yellow arrows showing the cracks. (b) The inverse pole figure map of the region shown in (a) indicates that the cracks formed along the grain boundary; (c) the corresponding KAM map shows that the crack regions have high KAM values.
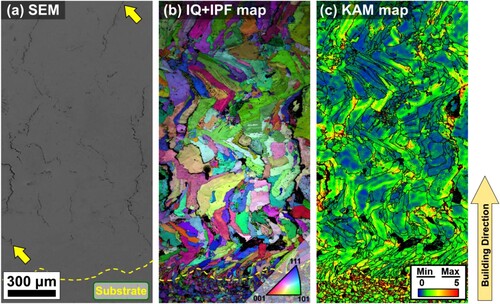
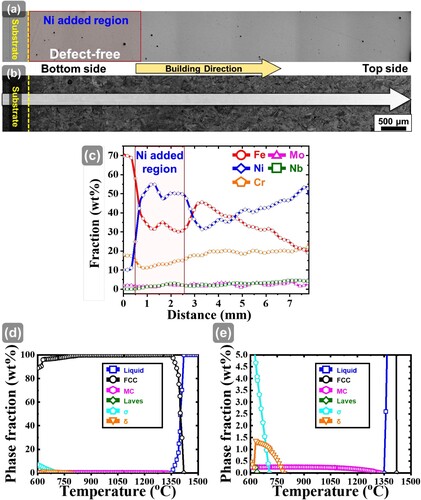
Figure 5. (a) OM, (b) SEM, and (c) corresponding EDS line profile results of the pure Ni-added CGM fabricated by in-situ alloying. Due to the local in-situ alloyed Ni, the local composition was changed and cracks disappeared (compared with the crack zone in ). (e) Equilibrium phase fraction with temperature for defect-free FGM at 12 wt% IN718, (f) the magnified diagram to clearly show minor phases.
Supplemental Material
Download MS Word (2.9 MB)Data availability
The raw/processed data required to reproduce these findings cannot be shared at this time as the data also forms part of an ongoing study.