
Figures & data
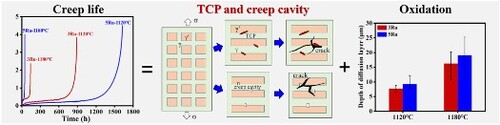
Table 1. Nominal composition of experimental superalloy (wt. %).
Figure 1. Creep data of the 3Ru and 5Ru alloys creep tested at 1120 and 1180 °C under 100 MPa tensile load. (a) Creep lives of the 3Ru and 5Ru alloys; (b) ∼ (e) Strain rate versus strain curves of 3Ru and 5Ru alloys in different states.
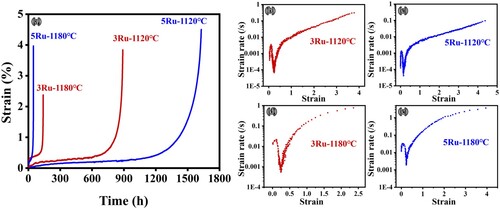
Figure 2. Microstructures of the two alloys under different conditions. (a) and (b) the 3Ru and 5Ru alloy in the initial state, respectively; (c) size distributions of the γ′ cuboids in the two alloys; (d) and (e) the 3Ru and 5Ru alloy after creep testing at 1120 °C/100 MPa, respectively; (f) and (g) the microstructures at a higher magnification of (d) and (e), respectively; (h) and (i) the 3Ru and 5Ru alloy after creep testing at 1180 °C/100 MPa; (j) and (k) volume fractions of the γ′ phase and densities of the creep cavity in the two alloys, respectively.
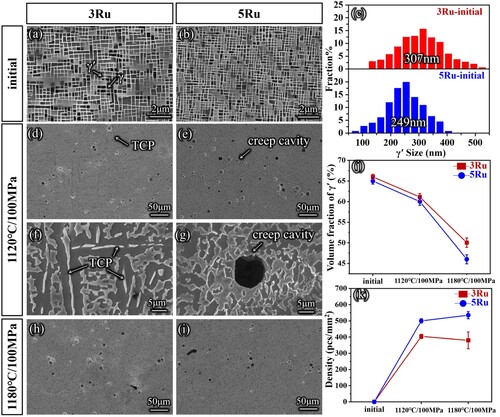
Figure 3. The microstructures of the two alloys after the creep interruption experiment with 48 h at 1180 °C/100 MPa. (a) and (b) microstructures of 3Ru and 5Ru alloys, respectively; (c) microstructure of 5Ru alloy at 6 mm below the fractured surface; (d) EDS mapping surrounding the creep cavity in 5Ru alloy; (e) the volume fractions of γ′ phase and densities of the creep cavities; (f) structure of oxide scale; (g) the depth of the diffusion layer.
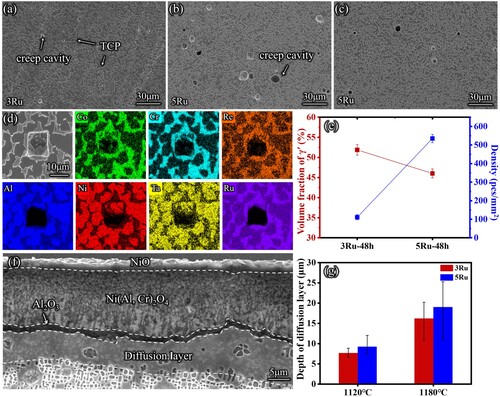
Figure 4. Morphologies of dislocation networks and element distributions around dislocations. (a) ∼ (d) The morphologies of dislocation networks; (e) ∼ (h) size distributions of the dislocation cell; (i) EDS element mapping around a dislocation in the 3Ru alloy after the creep test at 1120 °C/100 MPa.
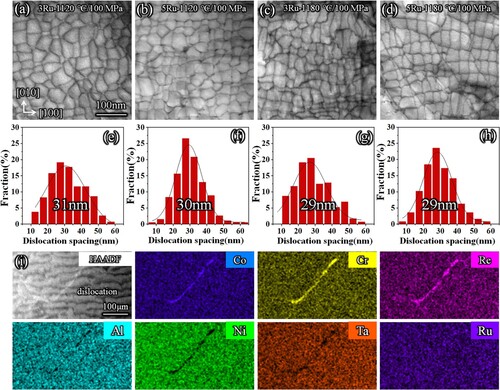
Table 2. Chemical composition measurement of matrix and dislocation (wt. %).