
Figures & data
Figure 1. Possible reduction pathways in electrochemical nitrogen conversion, leading to a variety of nitrogen-containing species with different nitrogen oxidation states.
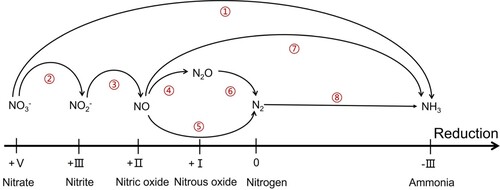
Figure 2. Multiple proposed N≡N cleavage and hydrogenation pathways in N2 reduction.
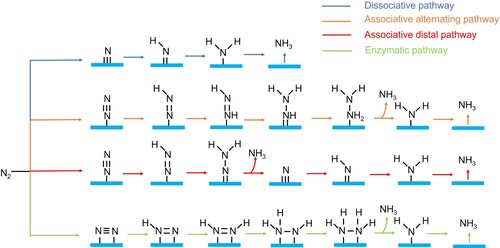
Figure 3. Possible reduction pathways of NOx conversion.
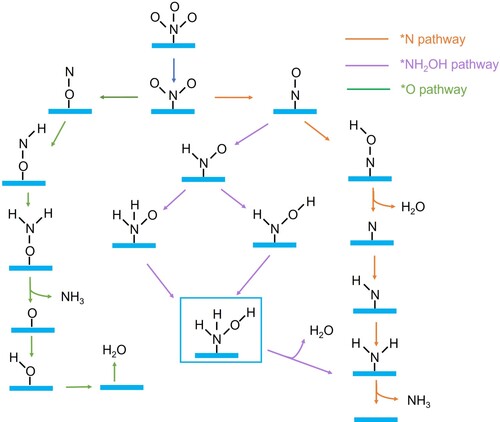
Table 1. Catalytic performances of SACs for ENRR and ENOxRR.
Figure 4. (a) Schematic illustration of synthetic procedure for AuSA/np-MoSe2. (b) NH3 yield rates and (c) FE at different applied potentials. Copyright 2022, John Wiley and Sons [Citation100]. (d) Scheme of the synthetic procedure for Ru SAs/N-C. (e) FE and (f) NH3 yield rates at different applied potentials. Copyright 2018, John Wiley and Sons [Citation99]. (g) FEs over Rh/MnO2 in a dilute electrolyte and water-in-salt electrolytes. Copyright 2022, Elsevier [Citation119].
![Figure 4. (a) Schematic illustration of synthetic procedure for AuSA/np-MoSe2. (b) NH3 yield rates and (c) FE at different applied potentials. Copyright 2022, John Wiley and Sons [Citation100]. (d) Scheme of the synthetic procedure for Ru SAs/N-C. (e) FE and (f) NH3 yield rates at different applied potentials. Copyright 2018, John Wiley and Sons [Citation99]. (g) FEs over Rh/MnO2 in a dilute electrolyte and water-in-salt electrolytes. Copyright 2022, Elsevier [Citation119].](/cms/asset/226206f4-0b71-448e-99d7-bc13be4e03d4/tmrl_a_2209156_f0004_oc.jpg)
Figure 5. (a) Transmission electron microscopy (TEM) image of FeSA-N-C. Scale bar, 50 nm. (b) The high-angle annular dark-field scanning transmission electron microscopy (HAADF-STEM) image of FeSA-N-C. Scale bar, 2 nm. (c) NH3 yield rates and FE at different applied potentials. (d) Surface-area-normalized NH3 yield rate at different applied potentials on FeSA-N-C and N-C. Copyright 2019, Spring Nature [Citation106]. (e) Schematic illustration of the synthetic process of Cu-N-C. (f) NH3 FE at different applied potentials. (g) i–t curve. Copyright 2022, John Wiley and Sons [Citation44]. (h) NH3 yield rates and (i) FE at various applied potentials. Copyright 2021, Elsevier [Citation129].
![Figure 5. (a) Transmission electron microscopy (TEM) image of FeSA-N-C. Scale bar, 50 nm. (b) The high-angle annular dark-field scanning transmission electron microscopy (HAADF-STEM) image of FeSA-N-C. Scale bar, 2 nm. (c) NH3 yield rates and FE at different applied potentials. (d) Surface-area-normalized NH3 yield rate at different applied potentials on FeSA-N-C and N-C. Copyright 2019, Spring Nature [Citation106]. (e) Schematic illustration of the synthetic process of Cu-N-C. (f) NH3 FE at different applied potentials. (g) i–t curve. Copyright 2022, John Wiley and Sons [Citation44]. (h) NH3 yield rates and (i) FE at various applied potentials. Copyright 2021, Elsevier [Citation129].](/cms/asset/8c5b31ac-74f8-49b4-b31f-2a664071eb43/tmrl_a_2209156_f0005_oc.jpg)
Figure 6. (a) Free-energy diagrams for ENRR on Mo/BCN through different reaction pathways. Copyright 2022, American Chemical Society [Citation111]. (b) N2-TPD curves of Co single-atom embedded N-doped porous carbon (CSA/NPC). Copyright 2019, Royal Society of Chemistry [Citation116]. (c) Optimized Fe-(O-C2)4 configuration, N2 adsorption at end-on and side-on and corresponding Bader charge distribution of *N2 (yellow and blue represent charge accumulation and depletion, respectively). Copyright 2020, John Wiley and Sons [Citation115]. (d) Pots of charge density difference. The red and dark blue regions represent electron density depletion and accumulation, respectively. Copyright 2022, John Wiley and Sons [Citation42]. (e) Free-energy diagrams for HER over Fe-MoS2 and MoS2. Copyright 2020, John Wiley and Sons [Citation104]. (f) Free-energy diagrams for ENO3−RR on M-MoS2 nanosheets. Copyright 2021, John Wiley and Sons [Citation123]. (g) Structure for copper-porphyrin molecule with eight substituent groups. Copyright 2016, American Chemical Society [Citation140]. (h) Schematic illustration of the catalyst depicted structure. Copyright 2022, American Chemical Society [Citation141].
![Figure 6. (a) Free-energy diagrams for ENRR on Mo/BCN through different reaction pathways. Copyright 2022, American Chemical Society [Citation111]. (b) N2-TPD curves of Co single-atom embedded N-doped porous carbon (CSA/NPC). Copyright 2019, Royal Society of Chemistry [Citation116]. (c) Optimized Fe-(O-C2)4 configuration, N2 adsorption at end-on and side-on and corresponding Bader charge distribution of *N2 (yellow and blue represent charge accumulation and depletion, respectively). Copyright 2020, John Wiley and Sons [Citation115]. (d) Pots of charge density difference. The red and dark blue regions represent electron density depletion and accumulation, respectively. Copyright 2022, John Wiley and Sons [Citation42]. (e) Free-energy diagrams for HER over Fe-MoS2 and MoS2. Copyright 2020, John Wiley and Sons [Citation104]. (f) Free-energy diagrams for ENO3−RR on M-MoS2 nanosheets. Copyright 2021, John Wiley and Sons [Citation123]. (g) Structure for copper-porphyrin molecule with eight substituent groups. Copyright 2016, American Chemical Society [Citation140]. (h) Schematic illustration of the catalyst depicted structure. Copyright 2022, American Chemical Society [Citation141].](/cms/asset/73448a83-18ee-44c3-87eb-b91df61e8e76/tmrl_a_2209156_f0006_oc.jpg)
Figure 7. (a) Schematic illustration of ENRR for Cu-Nx structure. (b) Free-energy diagrams for the ENRR on Cu-N2 through different reaction pathways. Copyright 2019, American Chemical Society [Citation117]. Calculated free energies for (c) NO3− adsorption and (d) NO2− adsorption on Cu (111), Cu-N4, and Cu-N2 surfaces, respectively. The brown, grey, blue and red balls represent C, N, Cu and O atoms, respectively. Copyright 2020, John Wiley and Sons [Citation149].
![Figure 7. (a) Schematic illustration of ENRR for Cu-Nx structure. (b) Free-energy diagrams for the ENRR on Cu-N2 through different reaction pathways. Copyright 2019, American Chemical Society [Citation117]. Calculated free energies for (c) NO3− adsorption and (d) NO2− adsorption on Cu (111), Cu-N4, and Cu-N2 surfaces, respectively. The brown, grey, blue and red balls represent C, N, Cu and O atoms, respectively. Copyright 2020, John Wiley and Sons [Citation149].](/cms/asset/d388ed07-7866-4995-9e71-74822dfb38b6/tmrl_a_2209156_f0007_oc.jpg)