Figures & data
Figure 1. XRD spectra and phase content statistics of experimental steels: (a)(c) CR, CCR, and VTR steels; and (b)(d) CR-A, CCR-A, and VTR-A steels.
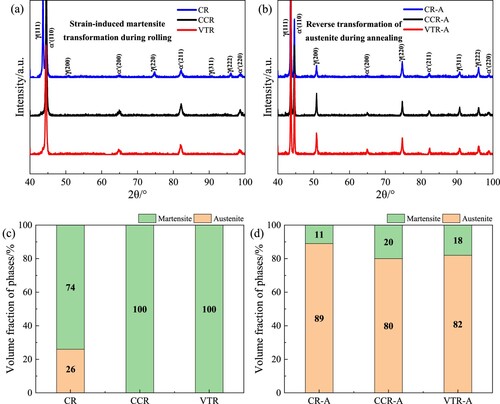
Figure 2. TEM micrographs of rolled steels with low and high magnifications: (a)(b) CR steel; (c)(d) CCR steel; (e)(f) VTR (3.5) steel by warm rolling to 3.5 mm; and (g)(h) VTR (2.5) steel by warm rolling to 3.5 mm and cryogenic rolling to 2.5 mm.
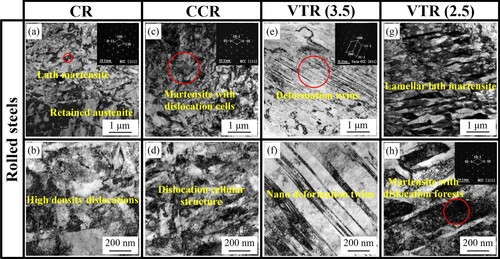
Figure 3. TEM micrographs of annealed steels with low and high magnifications: (a)(b) CR-A steel; (c)(d) CCR-A steel; and (e)(f) VTR-A steel.
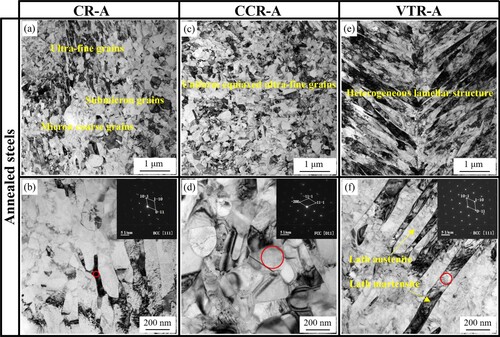
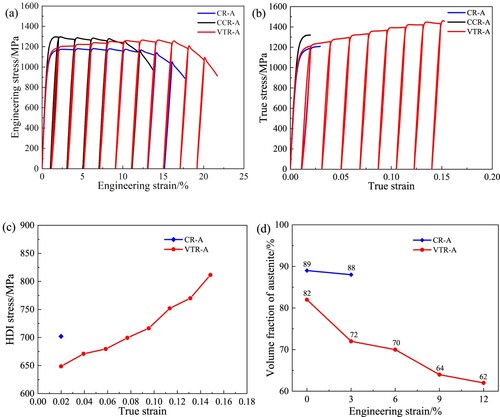
Figure 4. Tensile properties of annealed steels: (a) engineering stress-strain curves; (b) true stress-strain curves and work hardening rate curves; (c) yield strength; and (d) uniform elongation.
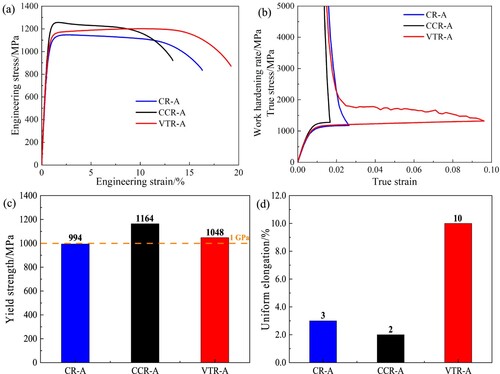
Figure 5. HDI stress and TRIP effect of annealed steels: (a) the load-unload-reload engineering stress-strain curves; (b) the load-unload-reload true stress-strain curves; (c) variation of HDI stress with true strain; and (d) variation of austenite phase content with engineering strain.