Figures & data
Figure 1. (a) Near-infrared pump, soft x-ray absorption probe experiment at the Ni absorption
analyzing the transiently modified electronic density of states above
at time delay
. (b) Ground state (blue squares) and pumped (circles) absorption spectrum at
ps. The pump-induced changes ΔXAS are modeled (green line) based on the static absorption spectrum which allows to distinguish the contributions of an energy shift and broadening. (c) Pump-induced change (black squares) including the modeling result in (b) (green line). The dashed (dotted) line indicates fits to the measured ΔXAS with only an energy shift (broadening), which are insufficient to describe the data.
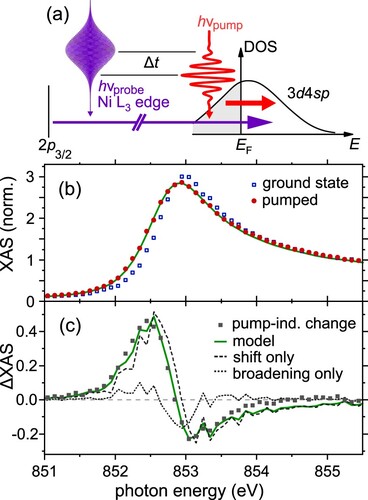
Figure 2. (a) Pump-induced changes ΔXAS at the indicated time delays from the experiment (markers) and TDDFT, respectively, DFT calculations (solid lines). For comparison, TDDFT calculations without local correlations (dashed line) and DFT calculations without (dotted line) a reduced magnetization (see text for details), are shown. Traces are vertically offset for easier viewing. (b) Time-dependent ΔXAS at eV with a fit (green line) and the corresponding values from TDDFT (convoluted with a Gaussian of 80 fs FWHM) and DFT, as indicated.
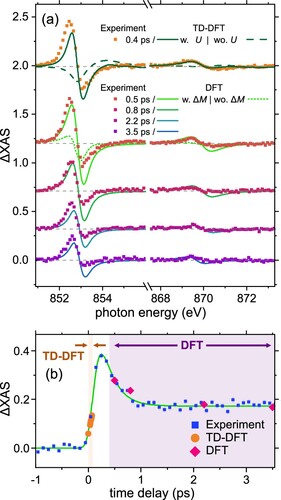
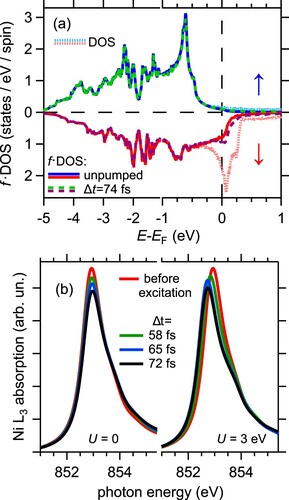
Figure 3. (a) Calculated populated exchange-split density of states for KS states in fcc Ni: for majority (↑) and minority (↓) states before optical excitation (solid lines) and at the longest TDDFT propagation time
fs (dashed lines). The static DOS without population is shown for comparison (dotted lines). (b) Absorption spectrum of the Ni
edge after optical excitation calculated by TDDFT using the transient
from panel (a) at left and including U=3 eV following Equations (Equation2
(2)
(2) ), (Equation3
(3)
(3) ) in addition to
at right.