Figures & data
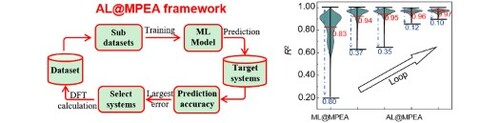
Figure 1. (a) The standard framework of ML-based material property prediction, which begins with the preparing materials dataset and training general ML models to predict the properties of new compounds on unknown broad spaces. The violin plot of distribution of determination coefficient for bulk modulus (B) and shear modulus (G) under one thousand trials by 80 MPEA datasets (ML@MPEA) and MP datasets constructed by 4898 ordered inorganic compounds datasets (ML@IC). The distribution of prediction accuracies is represented between the two black horizontal lines. The averaged prediction accuracy is denoted with red line. (b) The active learning guided density functional theory workflow (AL@MPEA). The AL@MPEA framework start with small number of DFT calculated MPEA datasets, using active learning loop to select poorly predicted candidates for DFT calculations, and feedback into the training data to improve the model's predictive ability. The violin plot of distribution of determination coefficient for bulk modulus under one thousand trials from ML@MPEA to AL@MPEA with four-loop iteration.
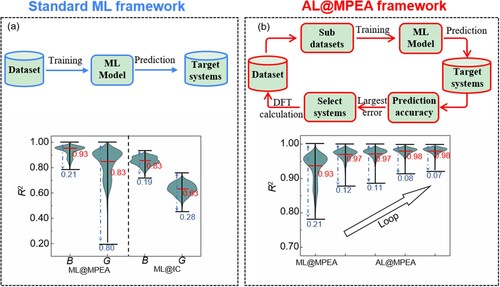
Table 1. Descriptors used to predict the bulk and shear modulus for gradient boosting decision tree models. The symbols represent valence electron concentrations (Nv), electronegativity difference (Δχ), mixing configurational entropy (ΔSmix), mixing enthalpy (ΔHmix), atomic radius (R), lattice constants of FCC structure (a), bulk modulus (B), shear modulus (G), Young’s modulus (E). bi is the concentration of i-th element, is the average electronegativity difference of alloys.
Figure 2. The variation of standard variance σ2 of B and G calculated from four-loop iteration. Active learning loop was performed by select 10 systems with the largest σ2 as candidates for DFT calculations, and feedback into the training data to improve the model’s predictive ability. After four-loop iteration, the σ2 values of B and G become smaller than 4 for all alloys, indicating the good stability of the ML model on the target training systems.
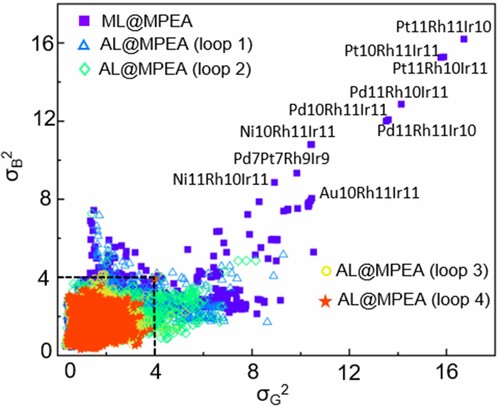
Figure 3. The performance of AL@MPEA model on predicting (a) bulk modulus and (b) shear modulus of 50 MPEAs, which are not included in the training data (red solid circle).
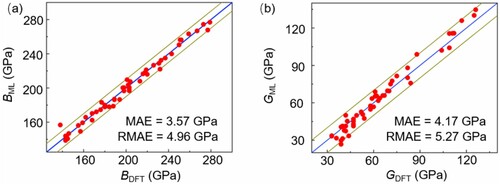
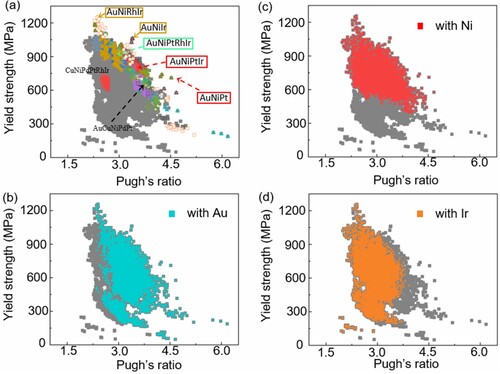
Figure 4. (a) Yield strength versus Pugh’s ratio (B/G) of 12,698 MPEAs combined by noble metals (gray square in the figure). The 27 systems (including 9 ternary alloys, 13 quaternary alloys, 4 quinary alloys and 1 senary alloy) in the outer contour possess high yield strength or toughness compared to the CuNiPdPtRhIr systems. (b)–(d) The distribution of alloys with Au, Ni, and Ir in the total 12,698 MPEAs.