Figures & data
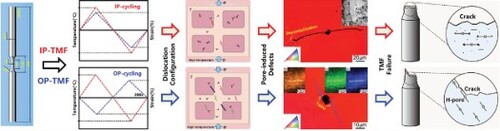
Figure 1. (a) γ/γ′-structure and distribution of γ′-size (in-set image), cross-sectional view of fracture surfaces and macroscopic fracture morphology (in-set images) after TMF failure at (b) IP-TMF and (c) OP-TMF, (d) cyclic stress response curves, evolution of hysteresis loops of the experimental alloy during (e) IP-TMF and (f) OP-TMF.
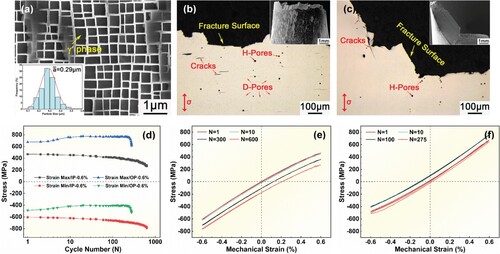
Figure 2. The EBSD analysis of typical pores near fracture surface after (a-c) IP-TMF and (d-f) OP-TMF cycling. (a) and (d) BSD maps, (b) and (e) IPF, (c) and (f) KAM maps. Inset of (e) displaying the typical orientation angle of the twinning bands.
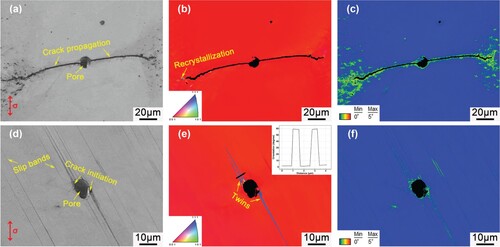
Figure 3. (a) Bright TEM image of the deformed structure close to micro-pore after IP-TMF, (b) high resolution images of APB (relatively low Z-contrast) in γ′ phase, (c) high resolution image of dislocation configuration crosses the γ/γ′-interface at IP-TMF, (d) bright TEM image of the pore-induced twin after OP-TMF, (e) contrast observation of dark TEM as well as selective diffraction patterns of the pore-induced twin, (f) high resolution image showing the nucleation of deformation twin at OP-TMF.
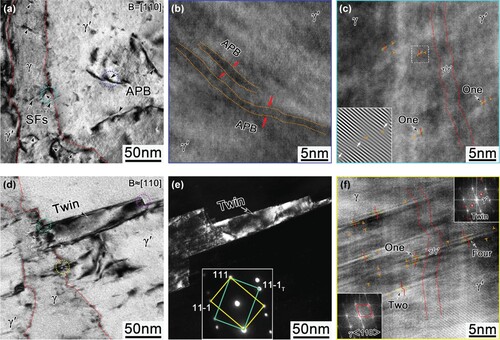
Figure 4. (a) High resolution image illustrating that the extension of deformation twin was partially impeded by γ/γ′-interface, (b) characteristic of typical CTB and ITB in the γ′ particle. HRSTEM-EDS element mapping displaying the element segregation at the γ/γ′-interface and CTB in γ′ phase (white cycle).
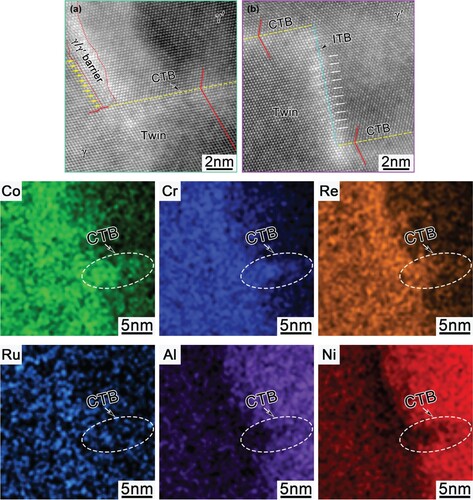
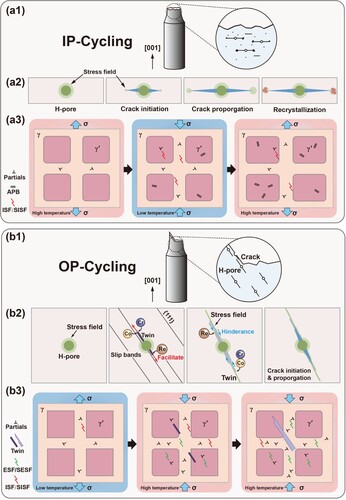
Figure 5. Schematic illustration of the formation and evolution of pore-induced defects as well as TMF fracture features in fourth-generation SX superalloy during IP- and OP-TMF processes. (a1) characteristic of flat fracture and horizontal cracking at IP-cycling, (a2) procedures of crack initiation and propagation as well as introduction of recrystallizations, (a3) evolution of dislocation configurations during consecutive high-temperature and low-temperature half cycles, (b1) characteristic of crystallographic fracture and cracking at OP-cycling, (b2) mechanisms of twinning formation and propagation as well as cracking along twinning boundary, (b3) evolution of dislocation configurations and contraction of twins during OP-TMF.