Figures & data
Figure 1. (a) Hardness evolution curves of the HPRed alloy during aging; (b) tensile engineering stress-strain curves for as-extruded, HPRed and peak-aged alloys; a comparison of (c) UTS and (d) toughness values as a function of elongation between the HPRed and peak-aged alloys in this work and previously reported Mg-Gd-Y-Zn-Zr alloys [Citation8,Citation11,Citation18,Citation20,Citation26–41].
![Figure 1. (a) Hardness evolution curves of the HPRed alloy during aging; (b) tensile engineering stress-strain curves for as-extruded, HPRed and peak-aged alloys; a comparison of (c) UTS and (d) toughness values as a function of elongation between the HPRed and peak-aged alloys in this work and previously reported Mg-Gd-Y-Zn-Zr alloys [Citation8,Citation11,Citation18,Citation20,Citation26–41].](/cms/asset/c80bef25-c50f-4aeb-884c-a55e3e2ba16a/tmrl_a_2235375_f0001_oc.jpg)
Figure 2. Microstructures of the HPRed alloy: (a) and (c) EBSD IPF images with corresponding legend; (b) grain size distribution of the FG region; (d–f) BF-TEM images of the FG region; (g) HRTEM image of the β phase at boundaries; (h) and (i) BF-TEM images showing γ′ particles in the FG and CG region, respectively; (j) HRTEM image and corresponding FFT pattern of γ′ particles.
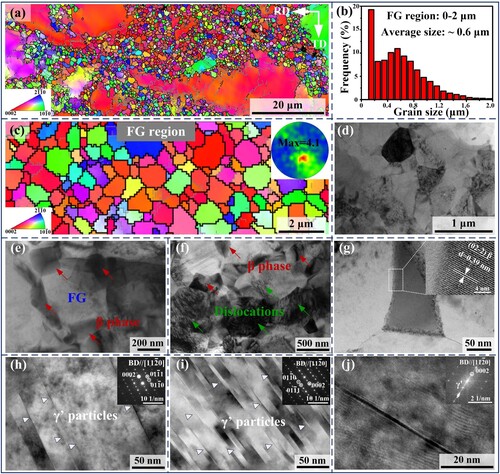
Figure 3. Microstructures of the peak-aged alloy: (a) EBSD-IPF map with corresponding legend, (b) grain size distribution, (c) BF-TEM and (d) HAADF-STEM image and corresponding EDS line scanning results of the FG region; (e) and (f) HAADF-STEM images of the FG region taken along ; (g-j) HAADF-STEM images of the CG region taken along
and
.
![Figure 3. Microstructures of the peak-aged alloy: (a) EBSD-IPF map with corresponding legend, (b) grain size distribution, (c) BF-TEM and (d) HAADF-STEM image and corresponding EDS line scanning results of the FG region; (e) and (f) HAADF-STEM images of the FG region taken along [112¯0]α−Mg; (g-j) HAADF-STEM images of the CG region taken along [0001]α−Mg and [112¯0]α−Mg.](/cms/asset/0d12e7f8-6d13-41c8-91da-3ce27aae324f/tmrl_a_2235375_f0003_oc.jpg)
Figure 4. 3-dimensional APT reconstructed atom maps of (a) Zn (green), (b) Gd (pink) and (c) Zn + Gd via the 0.8 at.% Zn and 2.5 at.% Gd isocomposition surfaces; (d) magnified image corresponding to region I in (c); compositional profiles for the (e) Zn-rich phase and (f) Gd-rich phase.
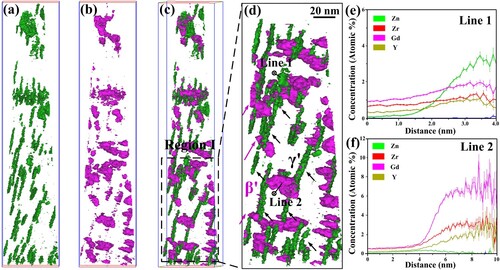
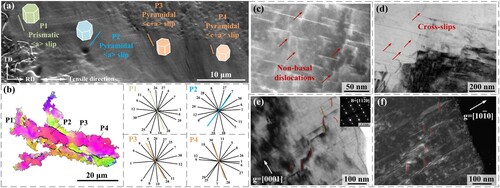
Figure 5. The microstructure of HPRed alloy stretched to a strain of ∼12%: (a) and (b) SEM and EBSD images. The calculated slip trace directions for the basal <a> slip, prismatic <a> slip, pyramidal <a> slip and pyramidal II <c + a> slip are indicated by 1 to 3, 4 to 6, 7 to 12, and 25 to 30, respectively; (c) and (d) HAADF-STEM and BF-TEM images; (e) and (f) TEM images viewed with g = 0001 and g = 01–10, respectively. The dislocations are marked by yellow lines and pyramidal <c+a> dislocations are mared by red lines.