Figures & data
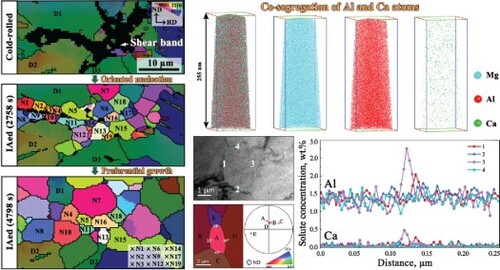
Figure 1. Quasi in-situ EBSD results showing the microstructure and texture evolution of the cold-rolled AX20 alloy during IA at 300 °C. (a, b, c) Cold-rolled, (d, e, f) 2578 s, (g, h, i) 3178 s and (j, k, l) 4798 s. (a, d, g, j) inverse pole figure (IPF) maps, (b, e, h, k) kernel average misorientation (KAM) maps, and (c, f, i, l) (0001) pole figures (PFs). The white dotted rectangles and white solid rectangles highlight the recrystallization induced by shear bands and GBs, respectively.
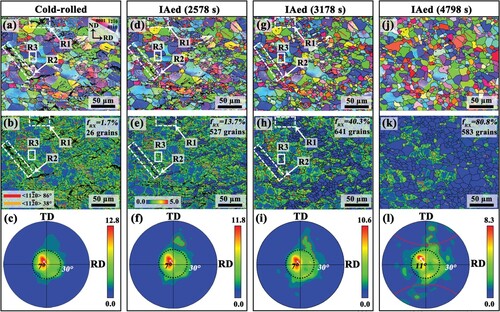
Figure 2. Twin-induced recrystallization during IA. (a, d, g, j) IPF maps, (b, e, h, k) grain orientation spread (GOS) maps. The threshold of GOS value for distinguishing deformed and recrystallized grains is 1.5°, with recrystallized grains marked in blue. (c, f, i, l) corresponding (0001) PFs for grains G1-G9, P1-P3 and the TTW in (b, e, h, k).
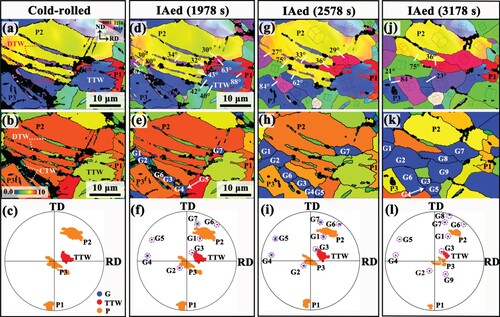
Figure 3. Shear band-induced recrystallization of AX20 alloys. (a-d) IPF maps of the (a) Cold-rolled, (b) annealed for 2578 s, (c) 3178 s and (d) 4798 s. The recrystallized grains are highlighted in bright colors. The recrystallized grains that are consumed during grain growth are indicated in the insets of IPFs. (e) (0001) PFs for grains N1-N19 in (b), and (f) (0001) PFs for grains N1-N19 in (d).
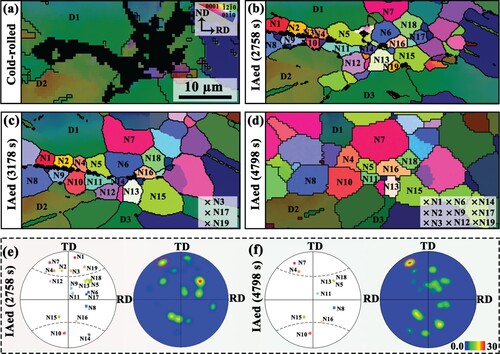
Figure 4. (a) The (0001) PF shows the definition of different texture components. (b) Number fractions, (c) average grain sizes of the ND-oriented, RD-oriented and TD-oriented recrystallized grains according to (a) and (d) misorientation angle distributions of boundaries between recrystallized grains under various annealing times. Fractions of boundaries delineating ND-oriented, RD-oriented and TD-oriented grains in alloys annealed for (e) 2578 s and (f) 4798 s.
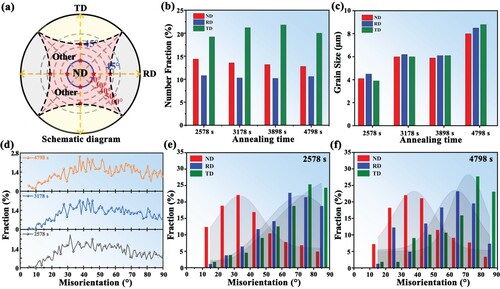
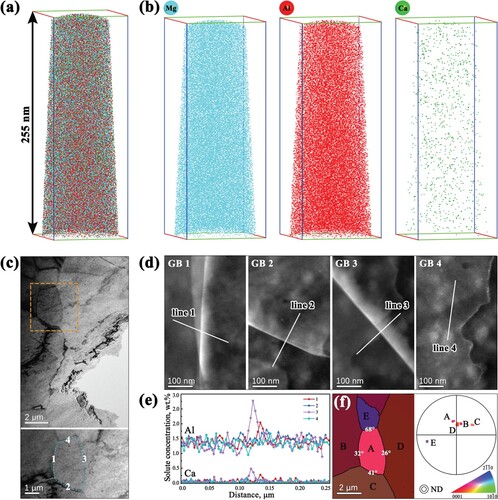
Figure 5. 3D-APT and STEM results of the alloy annealed at 300 °C for 3178 s. (a, b) 3D atom maps showing the distribution of Mg, Al and Ca. (c) Bright-field (BF) images and (d) HAADF-STEM images of the boundaries highlighted by the blue dashed line in (c), (e) EDX results displaying the distribution of Ca and Al solute atoms along GBs in (d), and (f) Transmission kikuchi diffraction (TKD)-IPF and (0001) PF of the area highlighted by the yellow rectangle in (c).