Figures & data
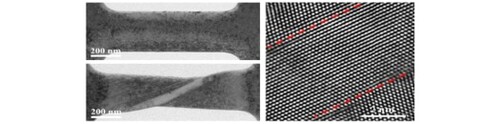
Figure 1. (a) EBSD characterization of Fe48Mn32Co10Cr10 alloy. (b) Nanoplate fabricated from a grain of the alloy using FIB. (c) Nanoscale deformation twins generated during straining. (d) The number and thickness of the deformation twins increased with strain. The insets in parts b-d show the corresponding SAED pattern of the deformed region. (e, f) HRTEM images captured before and after plastic deformation.
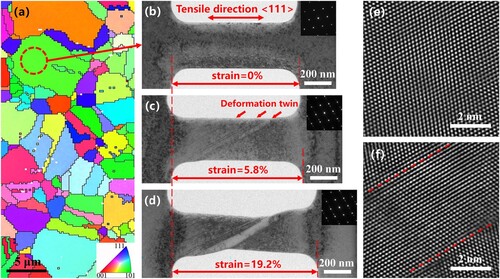
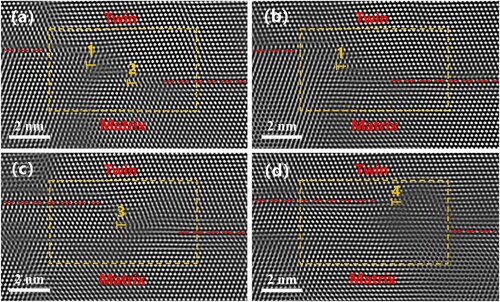
Figure 2. (a-d) In-situ HRTEM images of full dislocation interactions with the CTB and ITB in the Fe48Mn32Co10Cr10 alloy. The CTB is indicated by the red dashed line, and ITB is indicated by the dashed rectangle. Full dislocations are marked with symbol ‘T’.
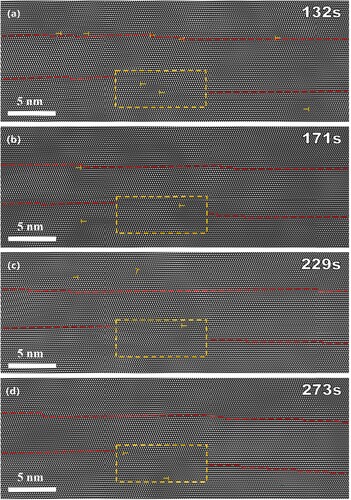
Figure 3. (a-d) Magnified HRTEM images showing the full dislocation-CTB interaction during deformation. (e, f) HRTEM extract from the framed region of (b, c).
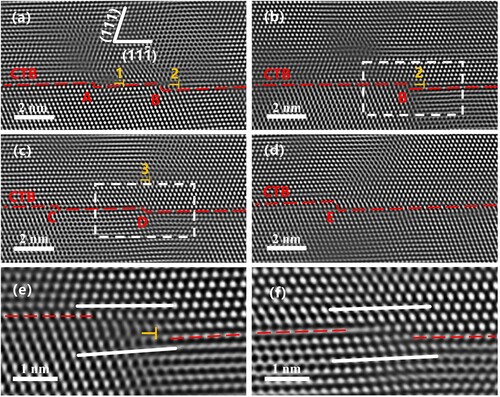
Figure 4. (a-d) Magnified HRTEM images showing the full dislocation-ITB interaction during deformation.