Figures & data
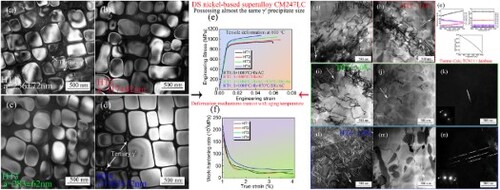
Table 1. Heat treatment schedules investigated in this study for the experimental alloy CM247LC.
Figure 1. The γ/γ′ microstructures (a–d) in CM247LC and corresponding tensile properties at 600°C (e,) after various heat treatments; (a) HT1; (b) HT2; (c) HT3; (d) HT4; (e) engineering stress-strain curves; (f) work-hardening rate plotted vs true strain.
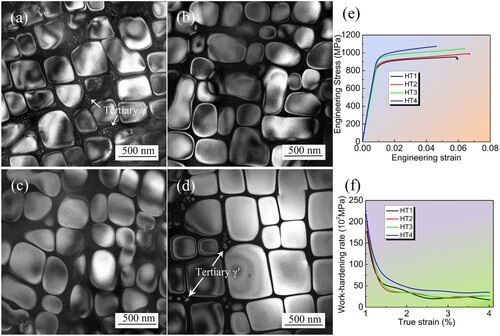
Figure 2. Deformed patterns in CM247LC after HT1 and HT2 as well as around 1.0% plastic strain and fracture at 600°C: (a,b) HT1; (c,d) HT2; (a) and (c) 1.0% plastic strain; (b) and (d) fracture.
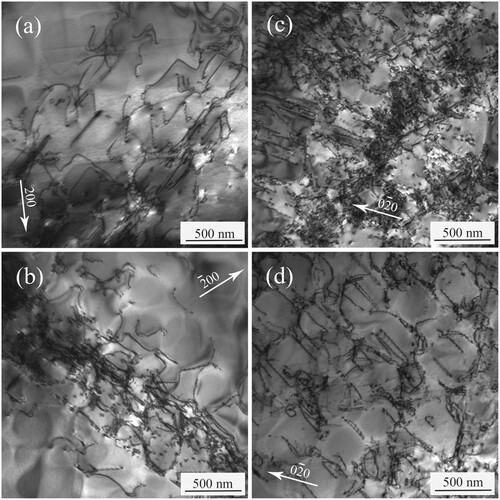
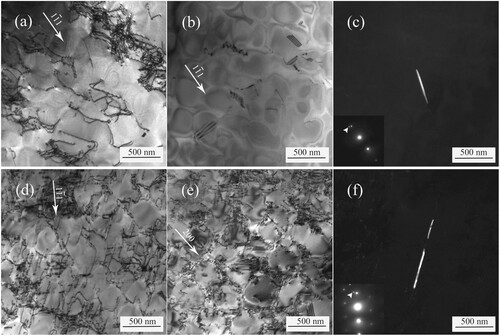
Figure 3. Deformed patterns in CM247LC after HT4 as well as around 1.0% plastic strain and fracture at 600°C: (a–c) 1.0% plastic strain; (d–f) fracture; (a) and (d) dislocation pairs and isolated SSFs; (b) and (e) isolated SSFs and ESFs; (c) and (f) MTs, the arrowheads indicate the spots of MTs.
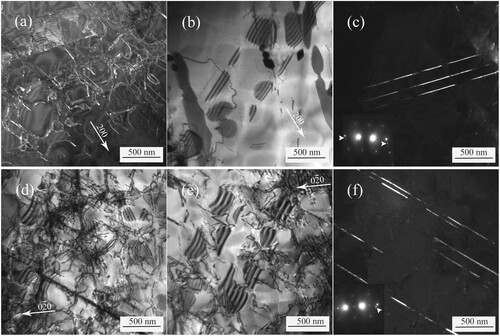
Figure 4. Deformed patterns in CM247LC after HT3 as well as around 1.0% plastic strain and fracture at 600°C: (a–c) 1.0% plastic strain; (d–f) fracture; (a) and (d) dislocation pairs; (b) and (e) isolated SSFs; (c) and (f) MTs, the arrowheads indicate the spots of MTs.