Figures & data
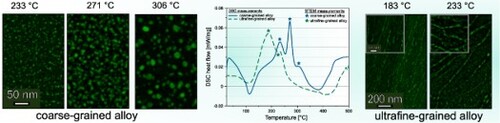
Figure 1. BFTEM images of (a) the coarse- and (b) ultrafined alloy. (c) shows the DSC heat-flow curves of a coarse-grained (blue continuous line) AlMgCuZnAg crossover alloy after solution heat-treatment (/35 min) and ultrafine-grained (green dashed line) AlMgCuZnAg crossover alloy. The sample was stored at RT for 30 days. The DSC experiments were performed with a linear heating rate of
.
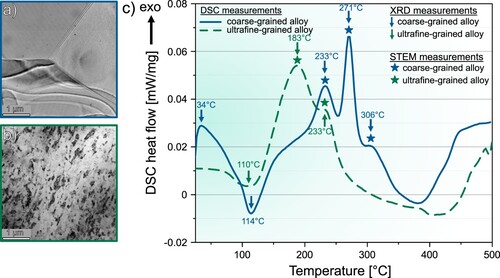
Figure 2. X-ray diffractograms of the coarse- and ultrafine-grained crossover Al alloy. The samples were heated with a linear heating rate of up to (a)
, (b)
, (c)
and (e)
, (f)
, (g)
, respectively. The plot in in (d) and (h) display the phase fraction of T-phase as a function of temperature and duration of isothermal ageing of the CG alloy and the UFG alloy, respectively. Note that the phase fraction was determined by Rietveld refinement. Black arrows pointing out the increase of reflection peaks.
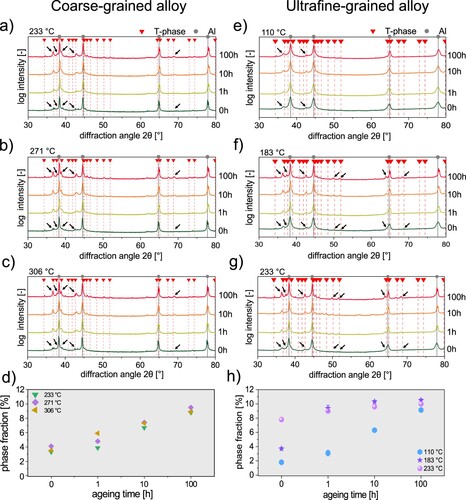
Figure 3. STEM HAADF and EDX elemental mappings of the coarse- and ultrafine-grained crossover Al alloy. The samples were heated with a linear heating rate of up to (a)
, (b)
, (c)
for the CG alloy and to (e)
, (f)
for the UFG alloy.
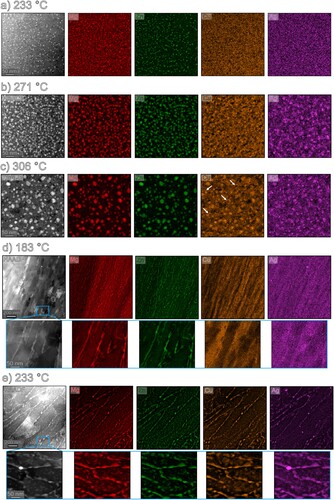
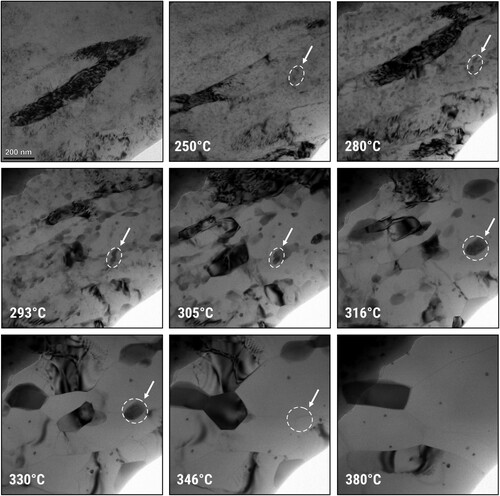
Figure 4. BFTEM images illustrating in situ TEM experiments conducted as a function of temperature on the UFG-AlMgZnCuAg alloy. The alloy underwent heat treatment using a MEMS heating holder, employing a linear heating rate of . Images are extracted from the video file; the scale bar displayed at RT applies to all micrographs.