Figures & data
Figure 1. Mechanical properties of LPBF-fabricated Al-Cu-Li-Sc-Zr alloy in both AF and HT states: (a, b) tensile curves of the alloy at various testing temperatures in the AF and HT states, respectively, (c, d) temperature-dependent yield strength and elongation compared with other LPBF-fabricated aluminum alloys (Al-Ce-Mn [Citation14], Al-Cu-Mn-Zr [Citation20], Al-Cu-Mn-Zr + TiO2 [Citation15], Al-Mg-Zr [Citation9], Al-Mg-Si-Sc-Zr [Citation10], Al-Si-Mg [Citation18, Citation19], Al-Si-Mg + TiCN [Citation16], Al-Ti-Cu-Mg-B-Ni-Fe [Citation29]).
![Figure 1. Mechanical properties of LPBF-fabricated Al-Cu-Li-Sc-Zr alloy in both AF and HT states: (a, b) tensile curves of the alloy at various testing temperatures in the AF and HT states, respectively, (c, d) temperature-dependent yield strength and elongation compared with other LPBF-fabricated aluminum alloys (Al-Ce-Mn [Citation14], Al-Cu-Mn-Zr [Citation20], Al-Cu-Mn-Zr + TiO2 [Citation15], Al-Mg-Zr [Citation9], Al-Mg-Si-Sc-Zr [Citation10], Al-Si-Mg [Citation18, Citation19], Al-Si-Mg + TiCN [Citation16], Al-Ti-Cu-Mg-B-Ni-Fe [Citation29]).](/cms/asset/76e47539-5e9b-4aae-b60e-c70b8b94e5e9/tmrl_a_2285388_f0001_oc.jpg)
Table 1. Tensile properties of as-fabricated and heat-treated samples at various testing temperatures.
Figure 2. EBSD results of (a ∼ d) AF and (e ∼ h) HT samples: (a) and (e) IPF maps; (b) and (f) pole figures; (c) and (g) equiaxed grain size statistical graph; (d) and (h) columnar grain size statistical graph.
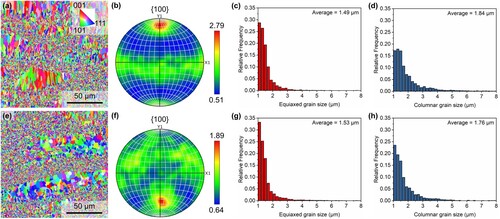
Figure 3. TEM analysis showing the HAADF images and corresponding EDS maps of: (a) equiaxed grain area of AF sample, (b) columnar grain area of AF sample, (c) equiaxed grain area of HT sample, and (d) columnar grain area of HT sample; (e) statistical results of precipitate size; EBSD analysis showing the TKD results within the equiaxed grain area of AF sample: (f) phase map and (g) IPF map.
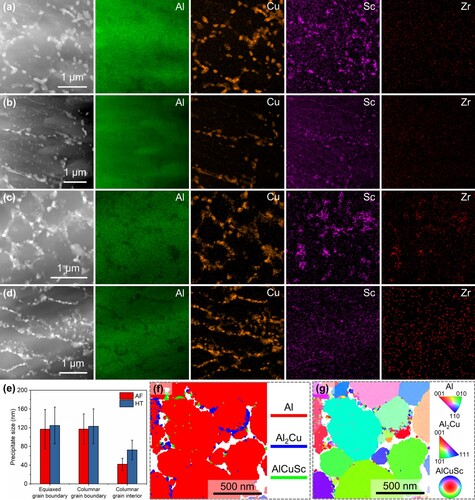
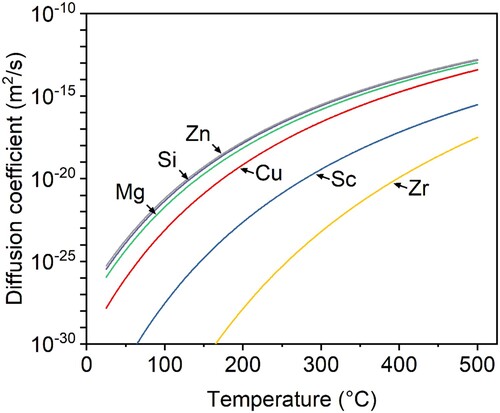
Figure 4. Diffusion coefficients of Cu, Sc, Zr, Mg, Si, and Zn in Al at different temperatures.