
Figures & data
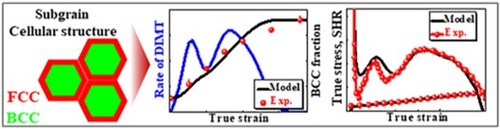
Table 1. Numerical parameters used for the DIMT evolution for uniaxial tensile deformation under RT and LNT.
Figure 1. Initial microstructure of AMed-FeMEA with dual-type regions. (a) EBSD phase map, and (b,c) EBSD phase map and EDS analysis for elemental composition distribution in each region of interest; (b) FCC phase grain, and (c) a mixture of FCC and BCC phases.
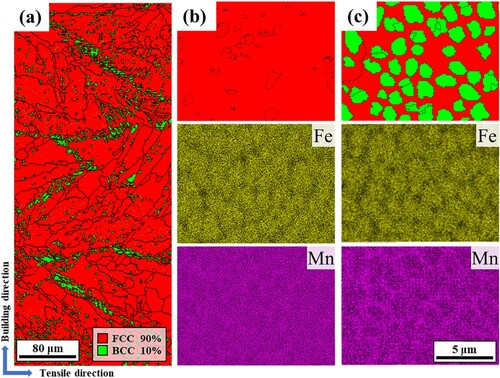
Figure 2. EBSD phase maps and FCC grain IPF maps of AMed-FeMEA at local strains of (a) 0.1 and (b) 0.3 after uniaxial tensile tests at RT.
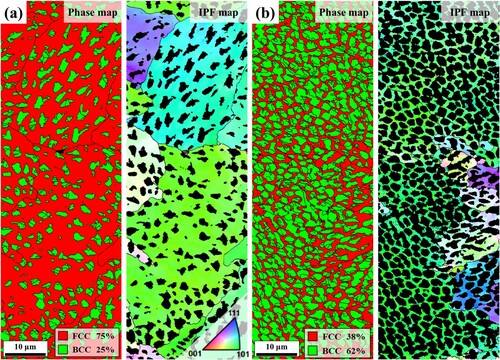
Figure 3. EBSD phase maps of AMed-FeMEA at local strains of (a) 0.1 and (b) 0.3 after uniaxial tensile tests at LNT. (c,d) GOS value distribution of BCC grains shown in (a) and (b), respectively.
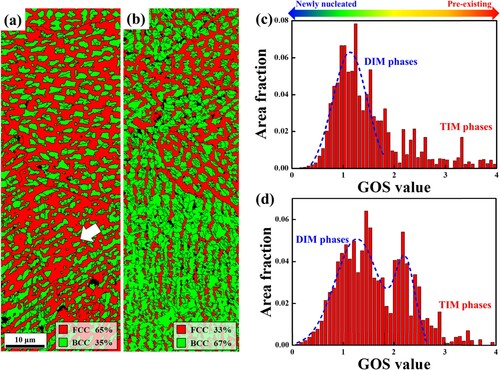
Figure 4. Comparison in (a) martensitic fraction evolution and (b) true stress and SHR vs. true strain curves with experimental data during uniaxial tensile deformation at RT.
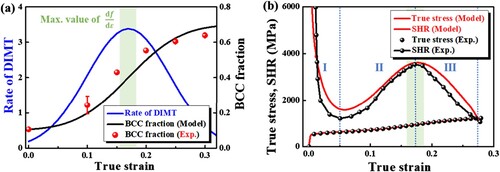
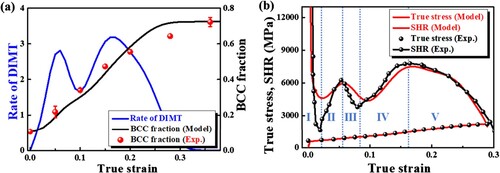
Figure 5. Comparison of (a) martensitic fraction evolution and (b) true stress and SHR vs. true strain curves with experimental data during uniaxial tensile deformation at LNT.
Supplemental Material
Download MS Word (2.4 MB)Data availability
The raw/processed data required to reproduce these findings cannot be shared at this time as the data also forms part of an ongoing study.