Figures & data
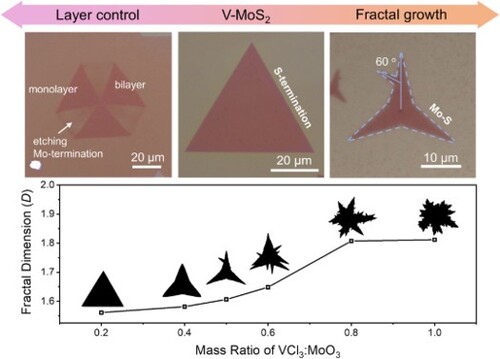
Figure 1. Growth and characterization of V-MoS2. (a) Schematic of the growth setup. (b) Atomic structure diagram of V-MoS2. (c) HAADF-STEM image of VCl3-doped V-MoS2 and (d) the corresponding atom-by-atom map to show the distribution of V atoms. (e) The magnified HAADF-STEM image of the area marked in (c) and the corresponding profile of Z-contrast intensity. (f) Raman spectra of undoped and VCl3-doped MoS2. (g) PL spectra of undoped and VCl3-doped MoS2.

Figure 2. Layer-controlled growth of V-MoS2. (a) Typical monolayer V-MoS2 flake. (b) Bilayer V-MoS2 flake with a hexagonal top layer. (c) Bilayer V-MoS2 flake with a three-bladed top layer. (d) HAADF-STEM image to show one edge of the hexagonal top layer, (e) the corresponding atomic structure, and (f) the corresponding Z-contrast intensity profile of the marked region in (d). (g) Schematic to show the growth process of the bilayer V-MoS2 flake. The blue line and yellow line correspond to the Mo-zz and S-zz edges, respectively.
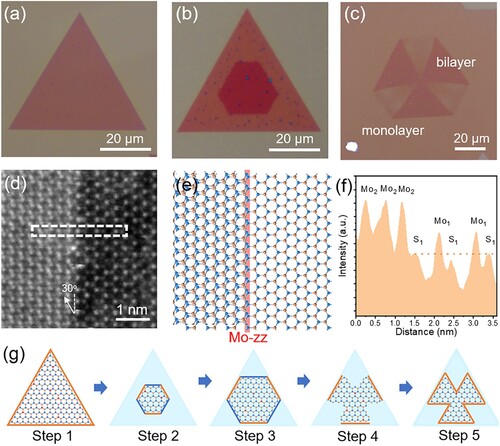
Figure 3. Fractal growth of monolayer V-MoS2 flakes. (a–f) Morphology evolution of monolayer V-MoS2 flakes grown with the increasing mass ratio of VCl3:MoO3 from (a) 1:4, (b) 2:5, (c) 1:2, (d) 3:5, (e) 4:5, and finally to (f) 1:1. (g) Relationship between D and the mass ratio of VCl3:MoO3.
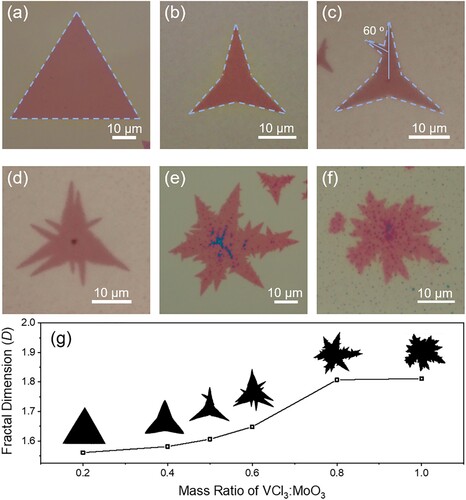
Figure 4. Fractal growth of V-MoS2 flakes. (a) Schematic of the fractal growth process. (b) HAADF image of the folded edge of a V-MoS2 flake, in which the folded bilayer region forms a Moiré pattern. (c) Schematic to show the corresponding arrangement of Mo atoms. (d) The corresponding lattice structure of the V-MoS2. The right region shows the bottom layer while the left region shows the top layer with a well-distinguished Mo-S-ac termination. The orange line and green dash line correspond to the S-zz and Mo-S-ac edges, respectively.
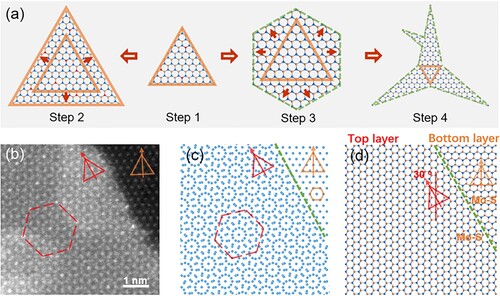
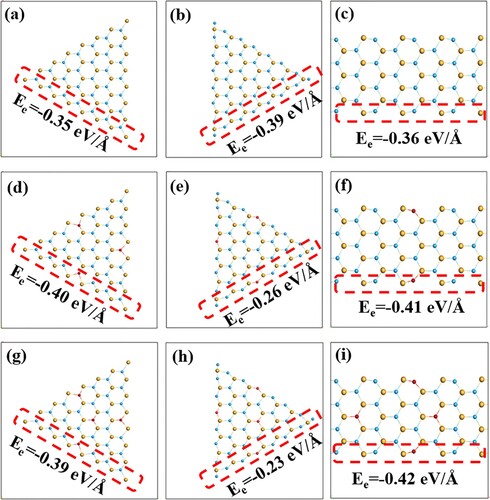
Figure 5. DFT calculation results of the edge formation energies of the undoped MoS2 and V-MoS2. (a–c) Undoped MoS2 with (a) S-zz, (b) Mo-zz, and (c) Mo-S-ac terminations. (d–f) MoS2 with V atoms at the edge terminated with (d) S-zz, (e) Mo-zz, and (c) Mo-S-zz. (g-i) MoS2 with V atoms at the edge and inside the bulk phase terminated with (g) S-zz, (h) Mo-zz, and (i) Mo-S-ac.