
Figures & data
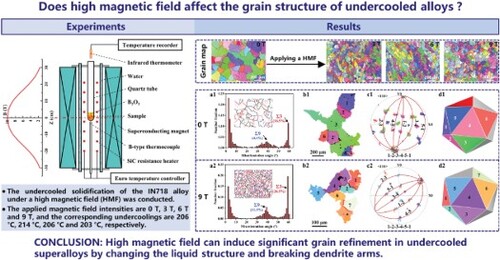
Figure 1. (a) Schematic illustration of the experimental facility for undercooling and solidification of alloys under high magnetic field. (b) An example of the temperature-time profile obtained by an infrared pyrometer. The heating rate is 0.62 °C/s, and the cooling rate is 0.16 °C/s. The required undercooling is achieved through repeated melting/freezing cycles. (c) Cooling and recalescence curves of the IN718 alloy showing approximately the same undercooling under different high magnetic fields.
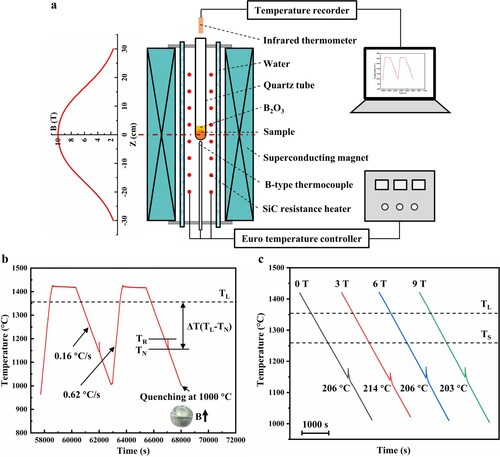
Figure 2. EBSD IPF maps with grain boundary overlay of the IN718 alloy solidified at a given undercooling under different high magnetic fields. LAGBs (misorientation angle: 2°∼15°) and HAGBs (misorientation angle: >15°) are represented by white and black lines, respectively. (a) 0 T, (b) 3 T, (c) 6 T, (d) 9 T.
Figure 3. (a1)∼(a4) GB misorientation angle distributions and corresponding GB distribution maps for the IN718 alloy solidified at a given undercooling under different high magnetic fields. The red, blue and black lines denote Σ3, Σ9 and random boundaries, respectively. The gray lines represent LAGBs. (b1) ∼ (b4) EBSD IPF maps of selected several nearest neighbor grains with twin orientation relationships. (c1) ∼ (c4) The <110> pole figures corresponding to b1, b2, b3 and b4, respectively, show the orientation relationships between pairs of grains 1-2, 2-3, 3-4, 4-5, 5-1. The red arcs of circles indicate common 111 twin planes. The 5-fold symmetry axis (i.e. common pole) is located at the intersection of the twin planes, highlighted by the black dashed circle. (d1)∼(d4) A schematic icosahedron whose facets have the same number and color as the grains in c1, c2, c3 and c4, respectively. (a1)∼(d1) 0 T, (a2)∼(d2) 3 T, (a3)∼(d3) 6 T, (a4)∼(d4) 9 T.
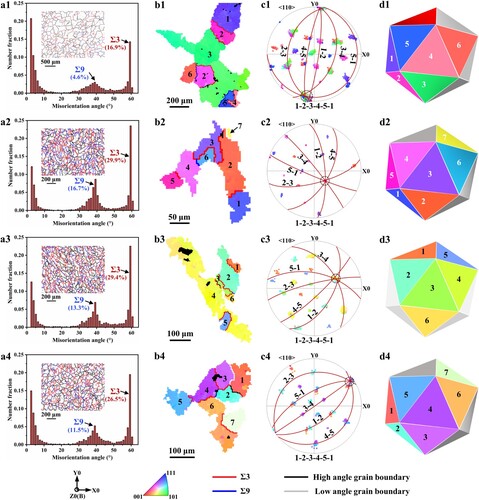
Figure 4. (a1) and (a2) EBSD IPF maps with drawn grain boundaries. The black and white lines denote HAGBs and LAGBs, respectively. (b1) and (b2) Corresponding KAM maps. (a1) and (b1) 0 T, (a2) and (b2) 9 T.
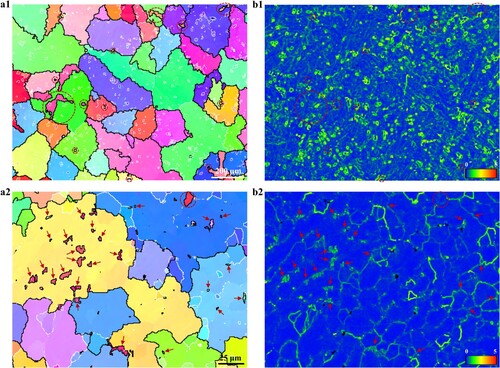
Figure 5. Schematic diagram showing the mechanism of high magnetic field-induced grain refinement in an undercooled nickel-based superalloy. (a) Under no magnetic field, (b) and (d) under a high magnetic field, (c) thermoelectric currents around a growing undercooled equiaxed dendrite [Citation40].
![Figure 5. Schematic diagram showing the mechanism of high magnetic field-induced grain refinement in an undercooled nickel-based superalloy. (a) Under no magnetic field, (b) and (d) under a high magnetic field, (c) thermoelectric currents around a growing undercooled equiaxed dendrite [Citation40].](/cms/asset/943f4424-7f61-49d2-bd6b-a577f519a045/tmrl_a_2360700_f0005_oc.jpg)