
Figures & data

Figure 1. Comparison of creep curves between the alloy TaTi and a Re-containing CMSX-4 type alloy (ERBO/1-3Re) [Citation5] at ∼760°C/800 MPa. (a) Creep strain vs. time; (b) creep rate vs. creep strain.
![Figure 1. Comparison of creep curves between the alloy TaTi and a Re-containing CMSX-4 type alloy (ERBO/1-3Re) [Citation5] at ∼760°C/800 MPa. (a) Creep strain vs. time; (b) creep rate vs. creep strain.](/cms/asset/071a2ef3-1674-4f91-8e8c-3997599c665e/tmrl_a_2362288_f0001_oc.jpg)
Figure 2. SEM images showing the typical γ/γ′ microstructures of alloy TaTi at 760°C/800 MPa with different creep times and strains. (a) horizontal sections; (b) longitudinal sections; (1) ε = ∼1.0%, t = ∼160 h; (2) ε = ∼5%, t = ∼608 h; (3)ε = ∼11%, t = ∼854 h.
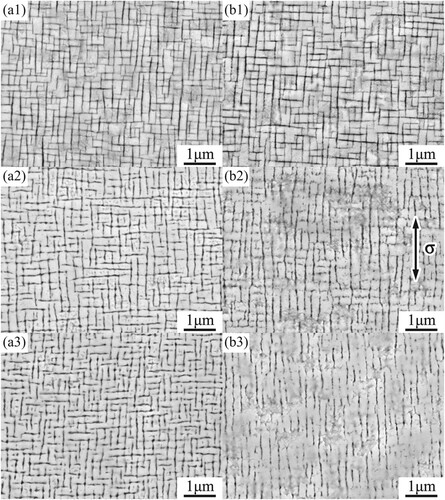
Table 1. Evolution of the volume fraction (Vγ′), area equivalent diameter (dγ′)/raft thickness (Dγ′) of γ′ phase and the width of γ channel (Dγ) during the creep at 760°C/800 MPa in alloy TaTi.
Figure 3. STEM images showing the typical deformation substructures of alloy TaTi at 760°C/800 MPa in different creep stages, B = [100]. (a) decelerating creep stage, ε = ∼0.06%; (b) accelerating creep stage, ε = ∼0.2%; slow accelerating creep stage at (c) ε = ∼1% and (d) ε = ∼5%.
![Figure 3. STEM images showing the typical deformation substructures of alloy TaTi at 760°C/800 MPa in different creep stages, B = [100]. (a) decelerating creep stage, ε = ∼0.06%; (b) accelerating creep stage, ε = ∼0.2%; slow accelerating creep stage at (c) ε = ∼1% and (d) ε = ∼5%.](/cms/asset/46f4f2f0-b077-48f0-94bd-6ab7041ca7b2/tmrl_a_2362288_f0003_ob.jpg)
Figure 4. HAADF-STEM image and corresponding EDX elemental mapping (at.%) of a SISF at 760°C/800 MPa with ε = ∼1% (t = ∼160 h), B = [110].
![Figure 4. HAADF-STEM image and corresponding EDX elemental mapping (at.%) of a SISF at 760°C/800 MPa with ε = ∼1% (t = ∼160 h), B = [110].](/cms/asset/cccc587a-e49d-449e-916b-868c2fd3fbfa/tmrl_a_2362288_f0004_oc.jpg)
Figure 5. Schematic diagram of the interactions between γ/γ′ microstructures and deformation substructures in different creep stages of (a) ERBO/1-3Re [Citation5] and (b) alloy TaTi at low temperature/high stress. (1) accelerating, (2) middle and (3) late stages of the creep process.
![Figure 5. Schematic diagram of the interactions between γ/γ′ microstructures and deformation substructures in different creep stages of (a) ERBO/1-3Re [Citation5] and (b) alloy TaTi at low temperature/high stress. (1) accelerating, (2) middle and (3) late stages of the creep process.](/cms/asset/47372d6c-f1af-40fc-b741-85f719e736b7/tmrl_a_2362288_f0005_oc.jpg)
Table 2. Creep properties of various single-crystal superalloys at ∼760 °C/high stress (80%∼90% yield strength) [Citation5,Citation23,Citation34].
Table 3. Evolution of substructures in γ′ phase of different SX superalloys during the critical creep stages at low temperature/high stress [Citation5,Citation28].
Supplemental Material
Download MS Word (141.5 KB)Data availability
The raw/processed data required to reproduce these findings cannot be shared at this time as the data also forms part of other ongoing studies.