
Figures & data
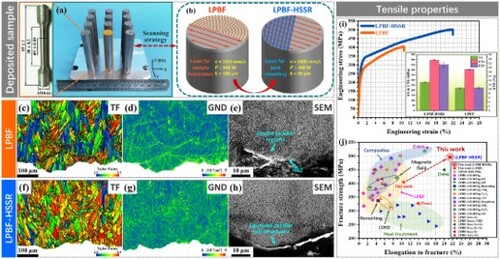
Table 1. Deposition and HSSR process parameters.
Figure 1. Microstructure of the LPBF and LPBF-HSSR samples. (a–a2) (i–i2) Band contrast (BC), inverse pole figure (IPF), and GND distribution maps of the samples. (b) (j) PF images of (a1) (i1), respectively. (c–d) (k–l) Grain equivalent diameters and aspect ratios, respectively. (e–f) (m–n) SEM images and aspect ratios of the cellular sub-structures. (g–h) (o–p) SEM images and size distributions of the precipitated nano-particles.
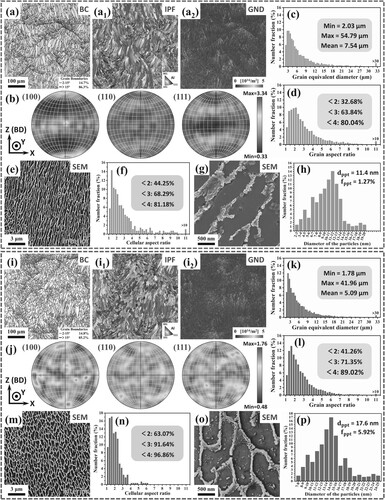
Figure 2. Molten pool temperature field and solidification conditions. (a–b) Longitudinal cross-sections of the temperature field in the molten pool for LPBF and LPBF-HSSR specimens, respectively. (c–d) Comparative analysis of temperature gradient , growth rate
, and cooling rate
at the isothermal melting interface for LPBF and LPBF-HSSR specimens. (e) Solidification maps illustrating
and
values under LPBF and HSSR conditions.
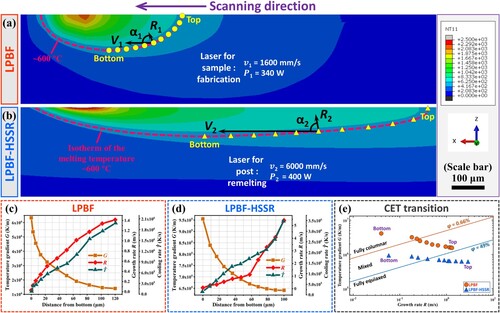
Figure 3. Uniaxial tensile properties. (a) Representative engineering stress–strain () curves. (b) Comparison of mechanical properties of the current LPBF-HSSR sample with those reported for LPBF [Citation44–53], heat treatment (HT) [Citation21–27], laser-directed energy deposition (LDED) [Citation43,Citation54], magnetic field (MF) application [Citation28,Citation29], remelting [Citation30], composite materials [Citation13–20], and high-strength aluminum alloy [Citation7–12]. (c) True stress (
) and work-hardening rate (
) plotted against true strain (
) with an inset showing a detailed view. (d) Work-hardening exponent (
) values across different strain stages.
![Figure 3. Uniaxial tensile properties. (a) Representative engineering stress–strain (σ−ϵ) curves. (b) Comparison of mechanical properties of the current LPBF-HSSR sample with those reported for LPBF [Citation44–53], heat treatment (HT) [Citation21–27], laser-directed energy deposition (LDED) [Citation43,Citation54], magnetic field (MF) application [Citation28,Citation29], remelting [Citation30], composite materials [Citation13–20], and high-strength aluminum alloy [Citation7–12]. (c) True stress (σt) and work-hardening rate (Θ) plotted against true strain (ϵt) with an inset showing a detailed view. (d) Work-hardening exponent (n) values across different strain stages.](/cms/asset/02ed4e61-214b-44c0-87fd-901cca6f09f7/tmrl_a_2370853_f0003_oc.jpg)
Table 2. Uniaxial tensile properties.
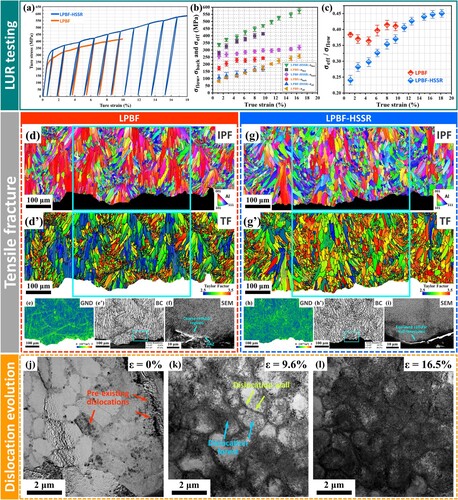
Figure 4. LUR tensile testing and fracture analysis. (a) LUR tensile testing results for both samples. (b) Evolution of the ,
, and
during tensile testing. (c) Proportion of the
in total
(
) at varying strain levels. (d–d’) (g–g’) IPF and TF images near the tensile fracture, respectively. (e–e’) (h–h’) GNDs and BC images of the blue box regions in (d) and (g), respectively. (f) (i) SEM images of the blue box regions in (e) and (h), respectively. (j–l) Dislocation evolution near the fracture under different strains.
Supplemental Material
Download MS Word (14.4 MB)Data availability statement
All relevant data are within the manuscript and its Additional files.