Figures & data
Table 1. Specification of ensemble simulations for both historical (present) and future (+4K) runs.
Figure 1. TC tracks around Tokyo Bay (200 km × 200 km scale) by (a) single ensemble and (b) 1,000 ensemble simulation.
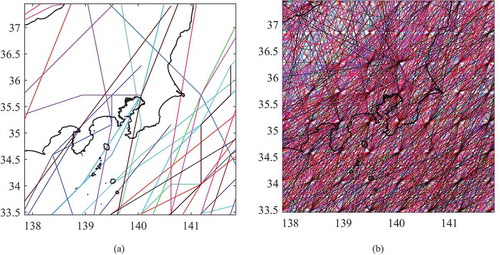
Figure 2. Validation of statistical model for maximum surge heights: Osaka Bay.
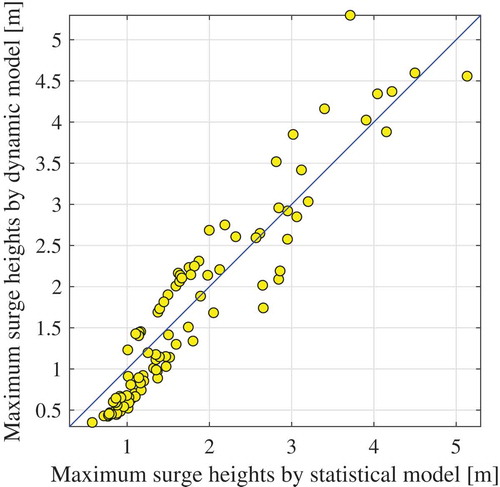
Figure 3. Non-exceedance probability of minimum central pressure Pmin for (a) global and (b) WNP (blue line: historical climate, red line: future climate (+4K), black line: observation by IBTrACS, shade: 95% confidence interval).
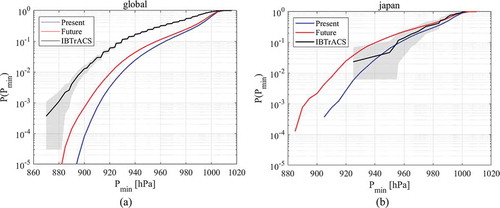
Figure 4. Probability density function of annual cyclogenesis number over (a) global and in (b) WNP (blue solid line: historical climate with 100 ensemble runs, blue dashed line: historical climate with 1 ensemble run, red solid line: future climate (+4K) with 90 ensemble runs, red dashed line: future climate (+4K) with 1 ensemble run, black line: observed (IBTrACS), shade: 95% confidence interval).
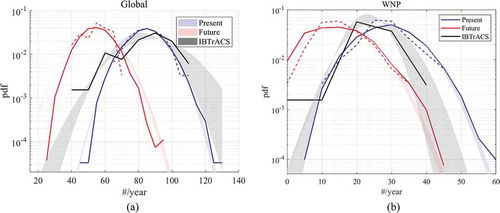
Figure 5. Future changes of centroids of TCs (upward triangle: cyclogenesis, circle: most developed, downward triangle: cyclolysis, blue: historical climate, red: future climate (+4K)). Changes are magnified by factor of 3.
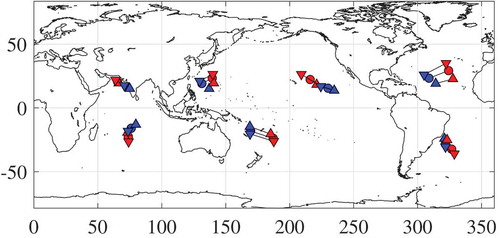
Figure 6. Future change in extreme distribution of storm surge height in Osaka Bay and Tokyo Bay, Japan. (Blue line: historical climate, red libne: future climate (+4K), thick colored line: empirical non-exceedance probability function, thin colored line: smoothed function).
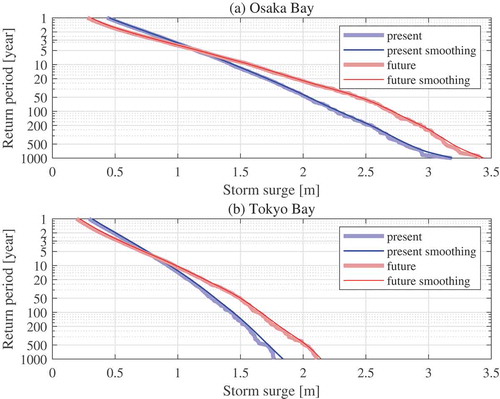
Figure 7. Future change components in extreme distribution of storm surge height in Osaka Bay, Japan. (Thick black line: total change of surge height, red solid line: change due to frequency, blue solid: change due to intensity and track shifts, green line: residual).
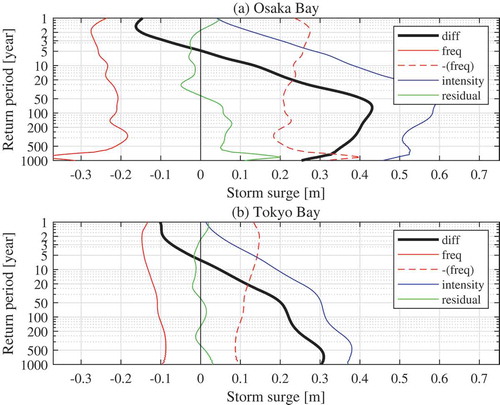
Figure 8. Comparison of 100-year return value of global extreme sea level along the coast derived from (a) reanalysis data (GTSR; Muis et al., 2016) and (b) this study. The value at each location is normalized by the global maximum value (unit: ratio).
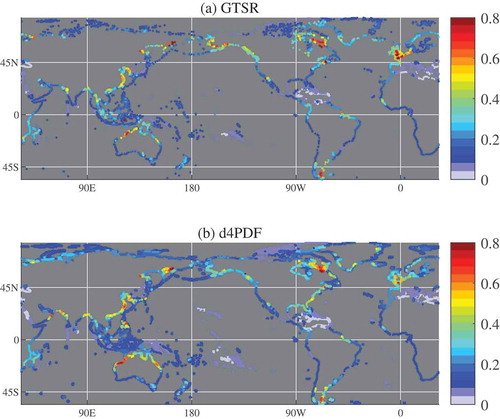
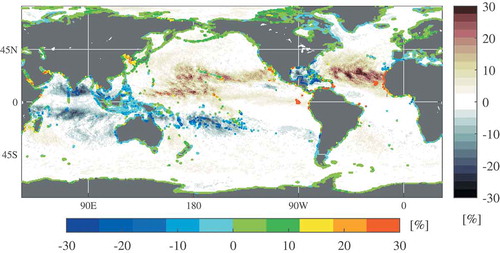
Figure 9. Future percent change in sea surface wind speeds (contour) and storm surges (coast line) in 100-year return periods. The right colorbar shows the range of sea surface wind speed change, the bottom colorbar shows the range of storm surge change, unit: percentage).
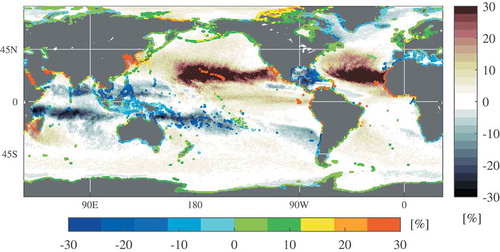
Figure 10. Same as (+4K warming experiment) but for +2K warming experiment.