Figures & data
Figure 1. Schematic diagram of a semi-infinite, leaky confined coastal aquifer system imposed by dual-frequency ocean tides on the coastline boundary (modified from Li and Jiao Citation2002a)
Figure 2. The response of hydraulic head within the leaky confined aquifer due to dual-frequency tidal fluctuations: (a) time-dependent variations over x = 0 to 300 m; (b) time-dependent variations at x = 100 m and 200 m, and compared with ocean tides
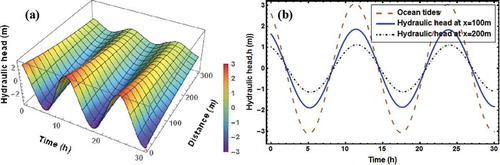
Figure 3. The effects of aquifer system hydraulic properties on the transport of ocean tides within the leaky confined aquifer: (a) effects of the hydraulic diffusivity of leaky confined aquifer; (b) effects of the leakage of semi-impermeable aquitard
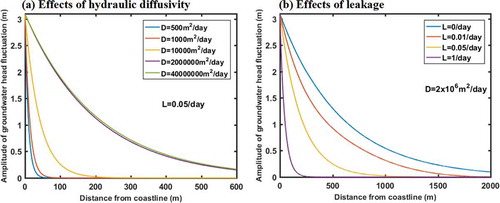
Table 1. The distance(m) at which the hydraulic head within the confined aquifer decays to 0.1 of the maximum amplitude of ocean tides
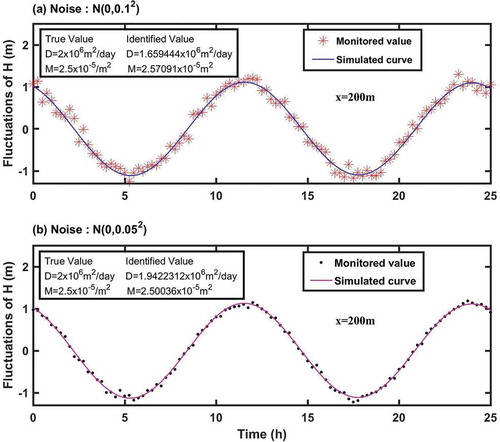
Figure 4. Comparisons between identified hydraulic parameters and true values, and simulated curves and monitored hydraulic heads: (a) noise = N(0, 0.12); (b) noise = N(0, 0.052)