
Figures & data
Figure 1. Study area and approximate rupture areas of documented historical tsunami precursor earthquakes
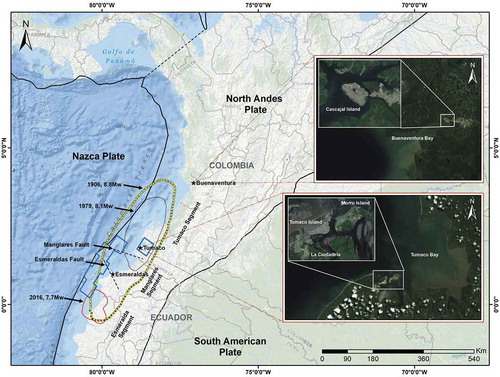
Figure 2. Slip deficit model scenarios considered in this study (Poveda and Pulido Citation2019): A worst-scenario, B 1906 scenario, and C 1979 scenario
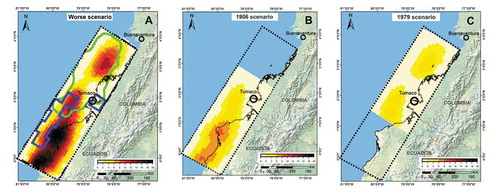
Figure 3. Broadband slip model scenarios considered in this study (Poveda and Pulido Citation2019) A worst-scenario, B 1906 scenario, and C 1979 scenario
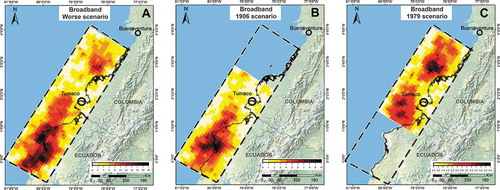
Table 1. Parameters used in the three slip deficit models and three broadband slip models (Poveda and Pulido Citation2019)
Figure 4. Average sea level regime determined for Tumaco
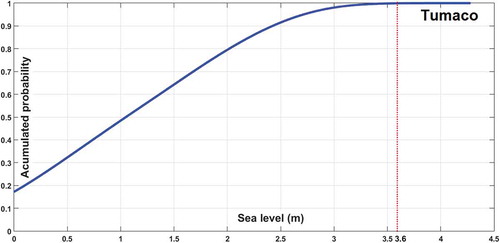
Figure 5. Average sea level regime determined for Buenaventura
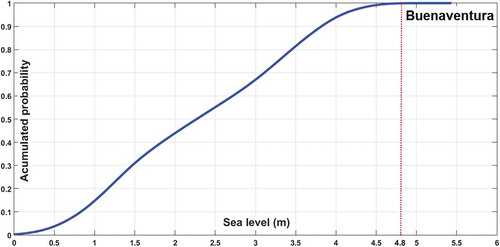
Figure 6. Computer grids. A 1: 810 m resolution grid; B 2: 270 m resolution grid; C 3: 90 m resolution grid; D 4: 30 m resolution grid; E 5: 10 m resolution grid]
![Figure 6. Computer grids. A 1: 810 m resolution grid; B 2: 270 m resolution grid; C 3: 90 m resolution grid; D 4: 30 m resolution grid; E 5: 10 m resolution grid]](/cms/asset/7973fe22-172a-4ed8-8201-70f0ec5b167d/tcej_a_1818362_f0006_oc.jpg)
Figure 7. Vertical deformation of the seafloor for each of the three scenarios of slip deficit models in the Colombo-Ecuadorian subduction zone: worst-case scenario (left), 1906 scenario (center), and 1979 scenario (right)
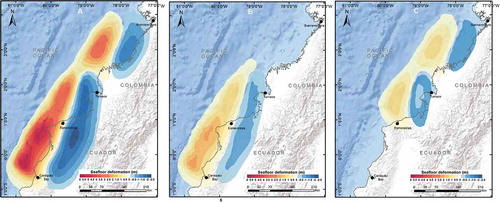
Figure 8. Vertical deformation of the seafloor for each of the three scenarios of broadband slip models in the Colombo-Ecuadorian subduction zone: worst-case scenario (left), 1906 scenario (center), and 1979 scenario (right)
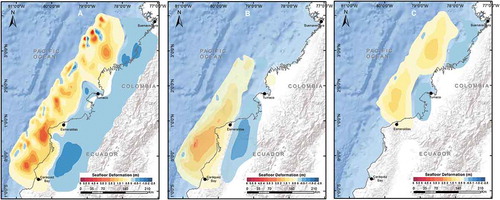
Table 2. Uplift and subsidence by segment for the scenarios
Figure 9. Variation of the free surface at selected points to record the evolution of the tsunami wave as it propagates into Buenaventura Bay: Worst-case scenario of the slip deficit model]
![Figure 9. Variation of the free surface at selected points to record the evolution of the tsunami wave as it propagates into Buenaventura Bay: Worst-case scenario of the slip deficit model]](/cms/asset/beaafe57-0a43-4f15-9c98-69ffe502ca2e/tcej_a_1818362_f0009_oc.jpg)
Table 3. Maximum tsunami height, maximum inundation distance, and inundation area for the tsunami simulations around Tumaco, Morro, and Cascajal Islands, for six scenarios
Figure 10. Tsunami height and run-up for slip deficit model scenarios. The worst-case scenario shows the maximum tsunami run-up. The top view is of Tumaco Island, the center view is of Morro Island and the bottom view is of Cascajal Island; left: worst case scenario; center: 1906 scenario; and right: 1979 scenario
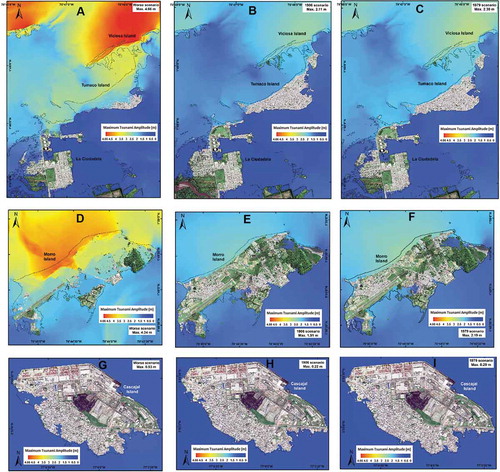
Figure 11. Tsunami height and run-up for broadband slip model scenario. The worst-case scenario shows the maximum tsunami run-up. The top view is of Tumaco Island, the center view is of Morro Island and the bottom view is of Cascajal Island; left: worst case scenario; center: 1906 scenario; and right: 1979 scenario
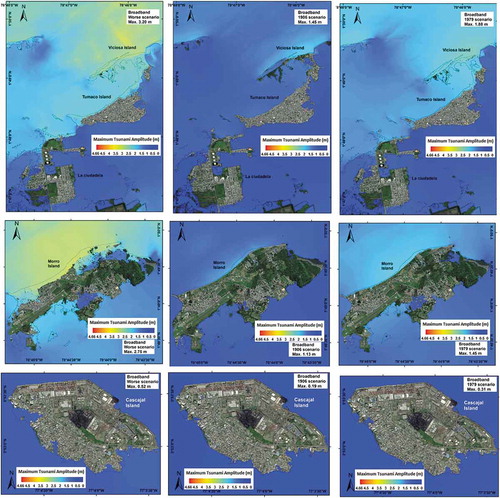
Figure 12. Inundation depth in meters, of the worst-case scenario of the slip deficit model for the Tumaco, Morro and Cascajal islands]
![Figure 12. Inundation depth in meters, of the worst-case scenario of the slip deficit model for the Tumaco, Morro and Cascajal islands]](/cms/asset/8e043d8b-989c-4849-b5ed-cb196f0eabd5/tcej_a_1818362_f0012_oc.jpg)