Figures & data
Figure 1. Location of the two artificial tidal flats where research was conducted in Tokyo Bay: Shiosai Nagisa and Kawasaki Hama, denoted in the figure as SN and KH, respectively
Figure 2. Photos and monitoring stations at (a) Shiosai Nagisa and (b) Kawasaki Hama, and cross-sectional structure of (c) Shiosai Nagisa and (d) Kawasaki Hama. Photograph of (b) was downloaded from the Geospatial Information Authority of Japan (https://mapps.gsi.go.jp/)
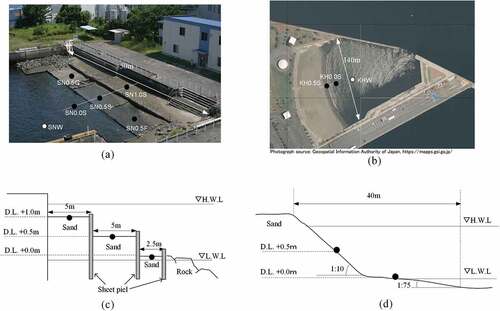
Table 1. Definition of ecosystem functions and their indices. The reference indicates the 100-point value of ecosystem functions
Table 2. Mean value of the water quality at Shiosai Nagisa (SN) and Kawasaki Hama (KH) during survey period (FY 2014 to FY 2017). The value in parentheses indicates the minimum value – maximum value
Figure 3. Continuous measurement data of water qualities at St. SNW in (FY 2014): (a) Water temperature, (b) Salinity, (c) Dissolved oxygen, and (d) Chlorophyll Fluorescence
Table 3. Mean value of the sediment quality at Shiosai Nagisa (SN) and Kawasaki Hama (HK) during survey period (FY 2014 to FY 2017). The value in parentheses indicates the minimum value – maximum value
Figure 4. Temporal variations of the species richness of benthos, wet weight of benthos, and chlorophyll-a on sediments at each station in Shiosai Nagisa and Kawasaki Hama
Figure 5. Annual mean scores of ecosystem functions at each station in Shiosai Nagisa and Kawasaki Hama. Each Ecosystem function were evaluated using define in . The names of some ecosystem functions are abbreviations as below, Fisheries: Fisheries resource abundance, Organic matter: Organic matter consumption, Carbon: Sediment carbon accumulation and Microalgae: Microalgae abundance
Table 4. Estimated coefficients of each ecosystem function model using the hierarchical Bayesian model. The value in parentheses indicates the 95% credible interval. The values in bold font indicates the coefficient that does not include zero in the 95% credible interval
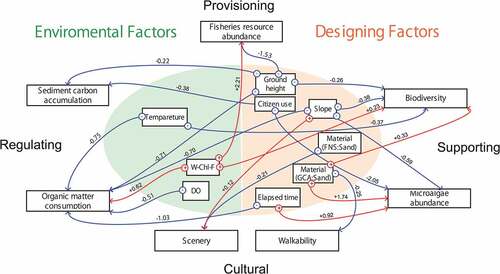
Figure 6. Visualized path analysis of the driving factors of ecosystem functions. The relationship between driving factors and ecosystem functions that do not include zero in the 95% credible interval is indicated by arrows. At the start of the arrow, the positive and negative directions of the coefficients are described, and on the line, the values of the coefficients are described. The arrows of the FNS and GCA to carbon storage are excluded because the carbon storage of FNS and GCA includes not only ecosystem functions but also manufacturing processes