Figures & data
Figure 1. Elevation view of the experimental set up. Coordinates (x, z) of key positions are shown (Arikawa et al. Citation2021).
Figure 2. Positions of building and tank models in the seaside area. x and y coordinates are shown for the upstream-right bank corners of the building models and for the centers of the tank models. The dashed lines in the figure are straight lines parallel to the x and y axes indicating the positions of the small cubic building models (Arikawa et al. Citation2021).
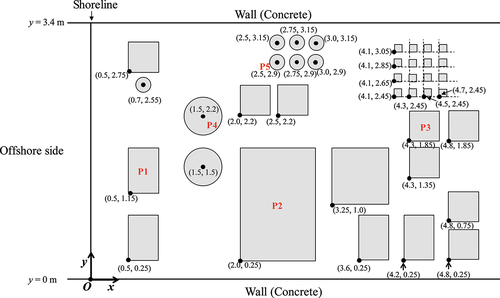
Figure 3. Dimensions of the building and tank models (Arikawa et al. Citation2021).
Figure 4. Photographs of building and tank models in the seaside area (Arikawa et al. Citation2021).
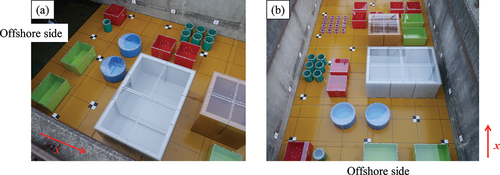
Figure 5. Locations of pressure-measurement lines on the building and tank models (Arikawa et al. Citation2021).
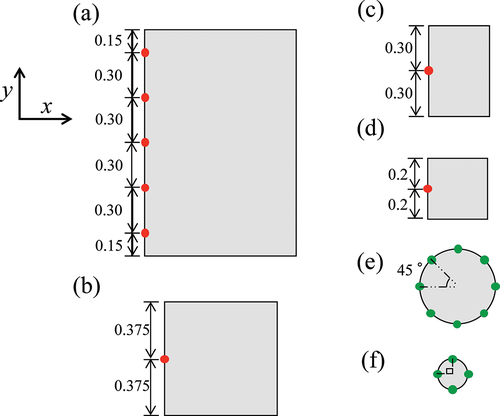
Figure 6. Locations of inundation depth and velocity measurements in the seaside area (red dots) (Arikawa et al. Citation2021).
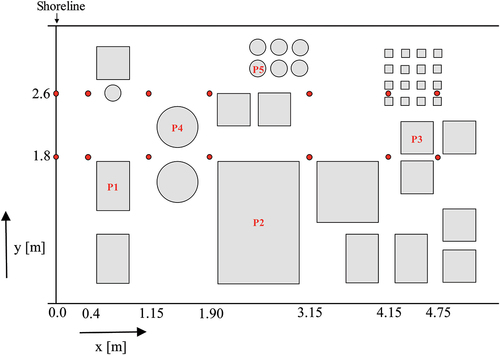
Table 1. Positions of the wave gage (WG) measurement points in the experimental set up (Arikawa et al. Citation2021)
Figure 7. Time-series of the water levels at (a) WG1 and (b) WG2 for tsunamis A and B (Arikawa et al. Citation2021).
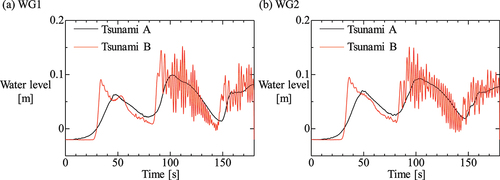
Figure 8. Positions of pressure measurement lines requested as the submission for building models (a) P1, (b) P2, and (c) P3 (Arikawa et al. Citation2021).
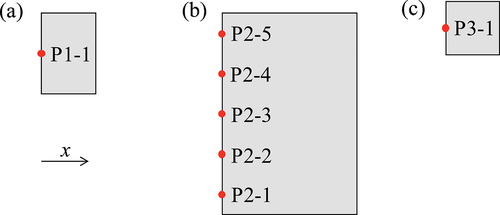
Figure 9. A schematic diagram of pressure integration (Arikawa et al. Citation2021).
Figure 10. Positions of pressure measurement lines requested as the submission for tank models (a) P4 and (b) P5 (Arikawa et al. Citation2021).
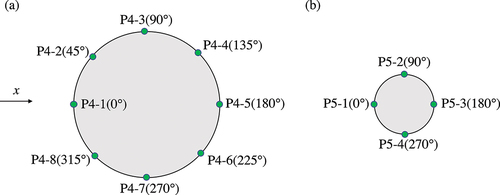
Table 3. The numerical simulation models used by the participants
Table 2. All conditions of numerical simulations submitted by the 14 participants
Table 4. The selected conditions of numerical simulations for the detailed analysis
Figure 11. The ratio of calculated values and observed values (Cal/Obs) at all observation sites for tsunami A. The simulation results of (a) Nonhydrostatic incompressible fluid dynamics model, (b) Nonhydrostatic compressible fluid dynamics model, (c) Nonlinear shallow water equation model, (d) SPH, (e) Three-dimensional and non-hydrostatic model, (f) Three-dimensional and multilayer hydrostatic model, and (g) Nonlinear dispersive wave model are shown.
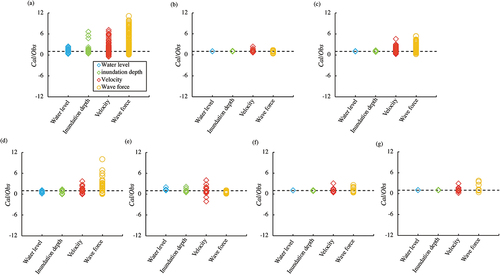
Figure 12. The ratio of calculated values and observed values (Cal/Obs) at all observation sites for tsunami B. The simulation results of (a) Nonhydrostatic incompressible fluid dynamics model, (b) Nonhydrostatic compressible fluid dynamics model, (c) Nonlinear shallow water equation model, (d) SPH, (e) Three-dimensional and non-hydrostatic model, (f) Three-dimensional and multilayer hydrostatic model, and (g) Nonlinear dispersive wave model are shown.
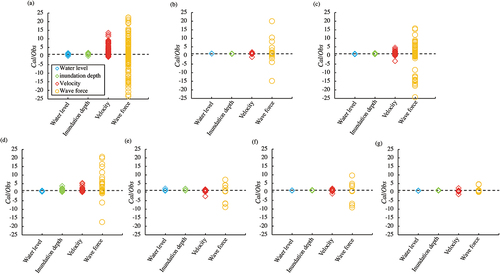
Figure 13. The ratio of calculated and observed water levels at −41.54 m (WG3), −30.0 m (WG4), −20.0 m (WG5), −10.0 m (WG6), −5.0 m (WG7), and 0.0 m (WG8) from the shoreline in the case of (a) tsunami A and (b) tsunami B.
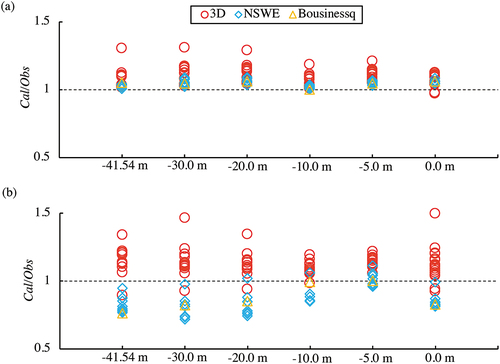
Figure 14. The ratio of calculated and observed inundation depths at 0.0 m, 0.4 m, 1.15 m, 1.90 m, 3.15 m, 4.15 m, and 4.75 m from the shoreline in the case of (a) tsunami A and y = 1.8 m, (b) tsunami A and y = 2.6 m, (c) tsunami B and y = 1.8 m, and (d) tsunami B and y = 2.6 m.
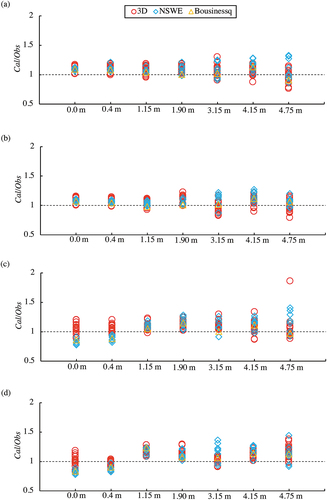
Figure 15. The ratio of calculated and observed velocities at 0.0 m, 0.4 m, 1.15 m, 1.90 m, 3.15 m, 4.15 m, and 4.75 m from the shoreline in the case of (a) tsunami A and y = 1.8 m, (b) tsunami A and y = 2.6 m, (c) tsunami B and y = 1.8 m, and (d) tsunami B and y = 2.6 m.
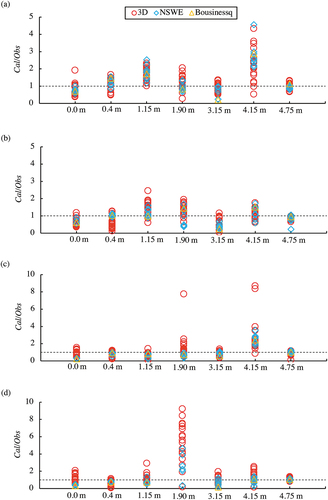
Figure 16. The ratio of calculated and observed wave forces at 0.5 m, 1.25 m, 2.0 m, 2.4 m, and 4.3 m from the shoreline in the case of (a) tsunami A and (b) tsunami B.
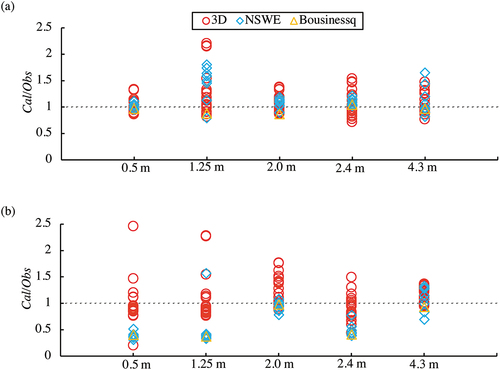
Figure 17. The ratio of calculated and observed wave forces at 0°, 45°, 90°, 135°, 180°, 225°, 270°, and 315° of P4 in the case of (a) tsunami A and (b) tsunami B. The ratio of calculated and observed wave forces at 0°, 90°, 180°, and 270° of P5 in the case of (c) tsunami A and (d) tsunami B are also shown.
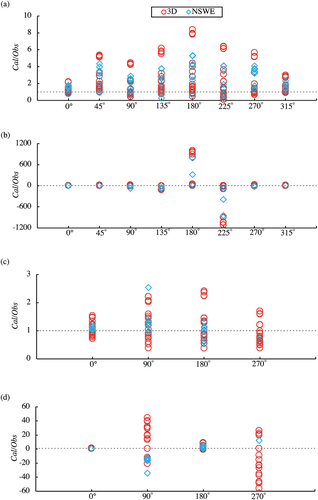
Figure 18. The ratio of calculated and observed values of (a) water levels, (b) inundation depths, (c) velocities, and (d) wave forces at all observation sites versus grid-cell size by 3D model and NSWE models in the case of tsunami A.
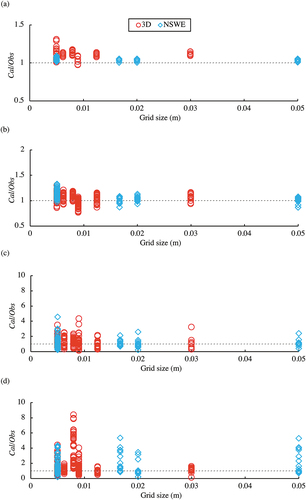
Figure 19. The ratio of calculated and observed values of (a) water levels, (b) inundation depths, (c) velocities, and (d) wave forces at all observation sites versus grid-cell size by 3D model and NSWE models in the case of tsunami B.
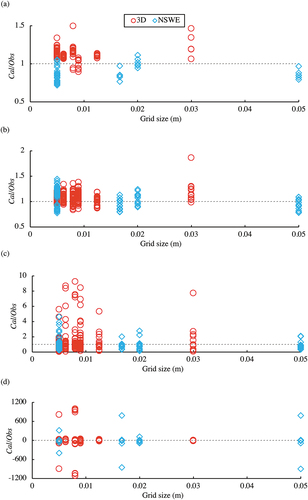
Figure 20. The ratio of calculated and observed values of (a) water levels, (b) inundation depths, (c) velocities, and (d) wave forces at all observation sites versus turbulence model used in the 3D model for Tsunami A. Models 1, 2, 3, 4, and 5 indicates without turbulence model (Laminar flow), dynamic k equation model in LES, Smagorinsky model in LES, standard k-εmodel in RANS, and stabilized k-ω in RANS, respectively.
Figure 21. The ratio of calculated and observed values of (a) water levels, (b) inundation depths, (c) velocities, and (d) wave forces at all observation sites versus turbulence model used in the 3D model for Tsunami B. Models 1, 2, 3, 4, and 5 indicates without turbulence model (Laminar flow), dynamic k equation model in LES, Smagorinsky model in LES, standard k-εmodel in RANS, and stabilized k-ω in RANS, respectively.
Figure 22. The K values for (a) 3D model, (b) NSWE model, and (c) Boussinesq model at all observation sites for tsunami A. The κ values for (d) 3D model, (e) NSWE model, and (f) Boussinesq model at all observation sites for tsunami A are also shown.
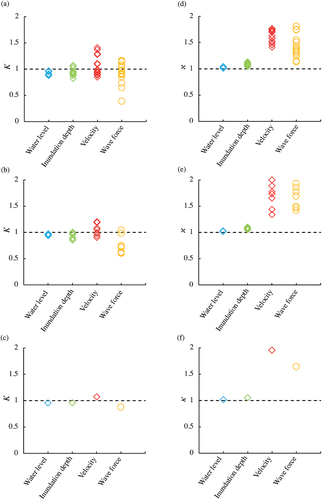
Figure 23. The K values for (a) 3D model, (b) NSWE model, and (c) Boussinesq model at all observation sites for tsunami B. The κ values for (d) 3D model, (e) NSWE model, and (f) Boussinesq model at all observation sites for tsunami B are also shown.
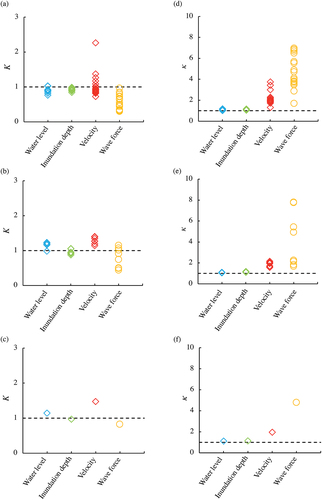
Figure 24. The κ values of water levels at −41.54 m (WG3), −30.0 m (WG4), −20.0 m (WG5), −10.0 m (WG6), −5.0 m (WG7), and 0.0 m (WG8) from the shoreline in the case of (a) tsunami A and (b) tsunami B.
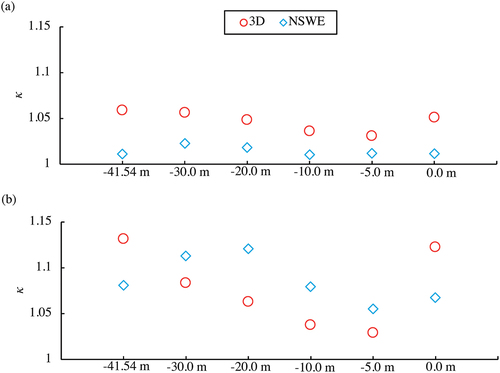
Figure 25. The κ values of inundation depths at 0.0 m, 0.4 m, 1.15 m, 1.90 m, 3.15 m, 4.15 m, and 4.75 m from the shoreline in the case of (a) tsunami A and y = 1.8 m, (b) tsunami A and y = 2.6 m, (c) tsunami B and y = 1.8 m, and (d) tsunami B and y = 2.6 m.
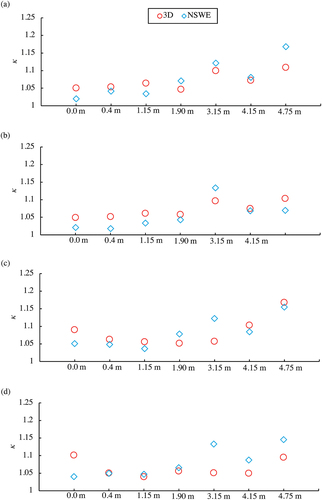
Figure 26. The κ values of velocities at 0.0 m, 0.4 m, 1.15 m, 1.90 m, 3.15 m, 4.15 m, and 4.75 m from the shoreline in the case of (a) tsunami A and y = 1.8 m, (b) tsunami A and y = 2.6 m, (c) tsunami B and y = 1.8 m, and (d) tsunami B and y = 2.6 m.
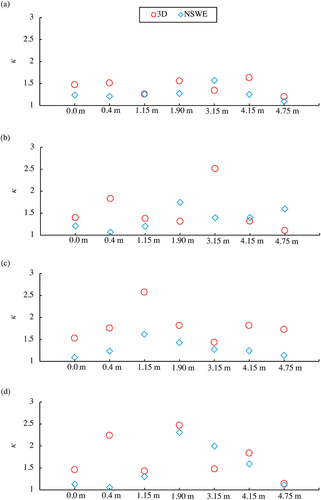
Figure 27. The κ values of wave forces at 0.5 m, 1.25 m, 2.0 m, 2.4 m, and 4.3 m from the shoreline in the case of (a) tsunami A and (b) tsunami B.
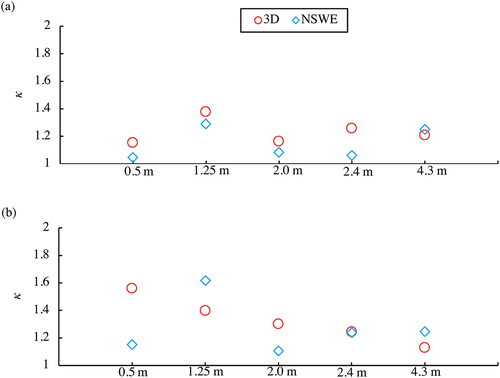
Figure 28. The κ values of wave forces at 0°, 45°, 90°, 135°, 180°, 225°, 270°, and 315° of P4 in the case of (a) tsunami A and (b) tsunami B. The ratio of calculated and observed wave forces at 0°, 90°, 180°, and 270° of P5 in the case of (c) tsunami A and (d) tsunami B are also shown.
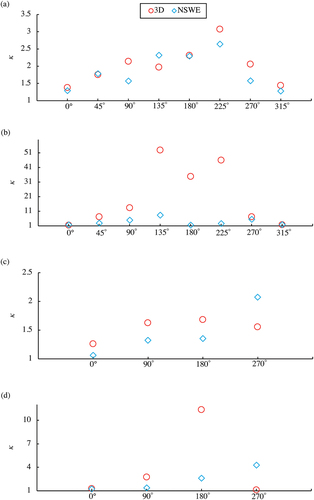
Figure 29. The κ values of (a) water levels, (b) inundation depths, (c) velocities, and (d) wave forces at all observation sites versus grid-cell size by 3D and NSWE models in the case of tsunami A.
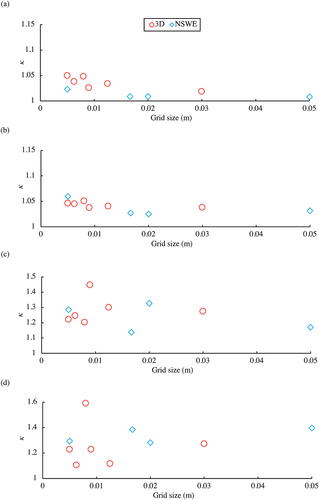
Figure 30. The κ values of (a) water levels, (b) inundation depths, (c) velocities, and (d) wave forces at all observation sites versus grid-cell size by 3D and NSWE models in the case of tsunami B.
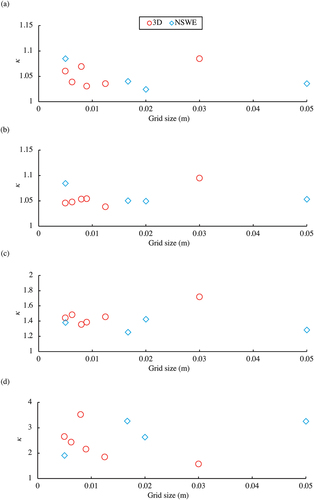
Figure 31. The κ values of (a) water levels, (b) inundation depths, (c) velocities, and (d) wave forces at all observation sites versus turbulence model used in the 3D model for Tsunami A. Models 1, 2, 3, 4, and 5 indicates without turbulence model (Laminar flow), dynamic k equation model in LES, Smagorinsky model in LES, standard k-εmodel in RANS, and stabilized k-ω in RANS, respectively.
Figure 32. The κ values of (a) water levels, (b) inundation depths, (c) velocities, and (d) wave forces at all observation sites versus turbulence model used in the 3D model for Tsunami B. Models 1, 2, 3, 4, and 5 indicates without turbulence model (Laminar flow), dynamic k equation model in LES, Smagorinsky model in LES, standard k-εmodel in RANS, and stabilized k-ω in RANS, respectively.
Figure 33. The RMSE values of water levels at −41.54 m (WG3), −30.0 m (WG4), −20.0 m (WG5), −10.0 m (WG6), −5.0 m (WG7), and 0.0 m (WG8) from the shoreline in the case of (a) tsunami A and (b) tsunami B.
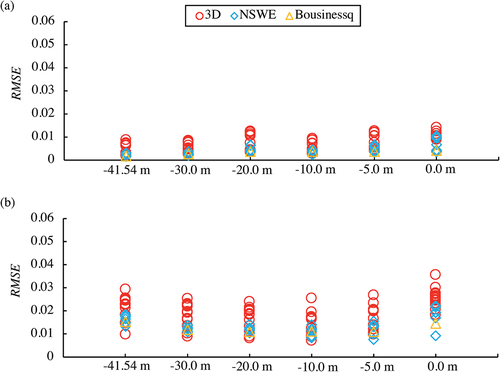
Figure 34. The RMSE values of inundation depths at 0.0 m, 0.4 m, 1.15 m, 1.90 m, 3.15 m, 4.15 m, and 4.75 m from the shoreline in the case of (a) tsunami A and y = 1.8 m, (b) tsunami A and y = 2.6 m, (c) tsunami B and y = 1.8 m, and (d) tsunami B and y = 2.6 m.
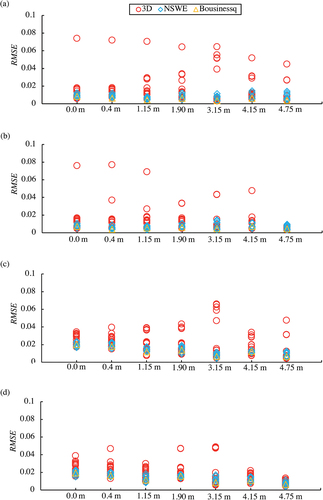
Figure 35. The RMSE values of velocities at 0.0 m, 0.4 m, 1.15 m, 1.90 m, 3.15 m, 4.15 m, and 4.75 m from the shoreline in the case of (a) tsunami A and y = 1.8 m, (b) tsunami A and y = 2.6 m, (c) tsunami B and y = 1.8 m, and (d) tsunami B and y = 2.6 m.
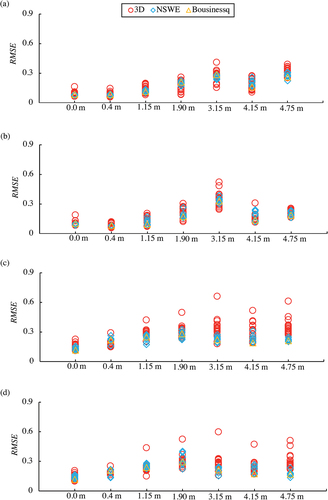
Figure 36. The RMSE values of wave forces at 0.5 m, 1.25 m, 2.0 m, 2.4 m, and 4.3 m from the shoreline in the case of (a) tsunami A and (b) tsunami B.
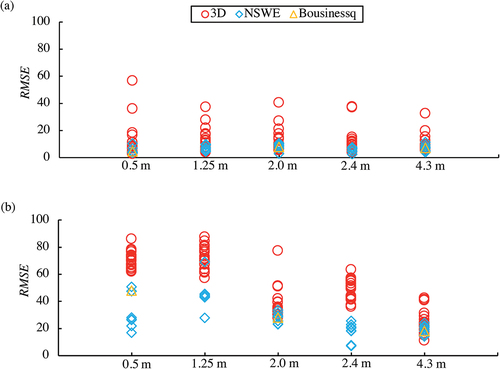
Figure 37. The RMSE values of wave forces at 0°, 45°, 90°, 135°, 180°, 225°, 270°, and 315° of P4 in the case of (a) tsunami A and (b) tsunami B. The ratio of calculated and observed wave forces at 0°, 90°, 180°, and 270° of P5 in the case of (c) tsunami A and (d) tsunami B are also shown.
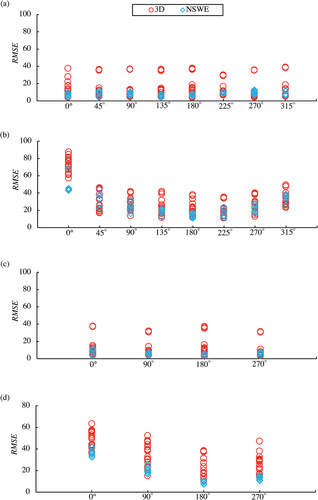
Figure 38. The RMSE values of (a) water levels, (b) inundation depths, (c) velocities, and (d) wave forces at all observation sites versus grid-cell size by 3D and NSWE models in case of tsunami A.
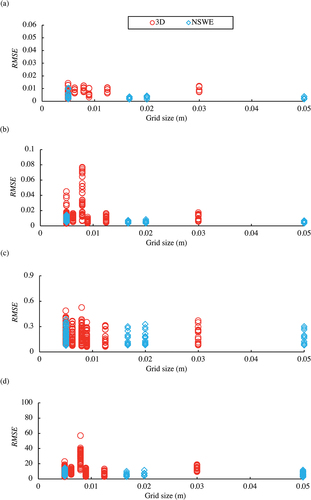
Figure 39. The RMSE values of (a) water levels, (b) inundation depths, (c) velocities, and (d) wave forces at all observation sites versus grid-cell size by 3D and NSWE models in case of tsunami B.
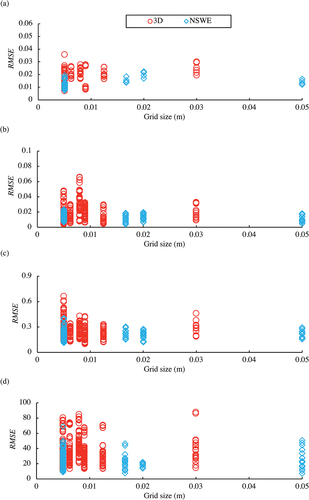
Figure 40. The RMSE values of (a) water levels, (b) inundation depths, (c) velocities, and (d) wave forces at all observation sites versus turbulence model used in the 3D model for Tsunami A. Models 1, 2, 3, 4, and 5 indicates without turbulence model (Laminar flow), dynamic k equation model in LES, Smagorinsky model in LES, standard k-εmodel in RANS, and stabilized k-ω in RANS, respectively.
Figure 41. The RMSE values of (a) water levels, (b) inundation depths, (c) velocities, and (d) wave forces at all observation sites versus turbulence model used in the 3D model for Tsunami B. Models 1, 2, 3, 4, and 5 indicates without turbulence model (Laminar flow), dynamic k equation model in LES, Smagorinsky model in LES, standard k-εmodel in RANS, and stabilized k-ω in RANS, respectively.