
Figures & data
Figure 1. Concentration of households that sold farmland in response to shocks per county – 2005/2006 KIHBS (the color density represents the spread of cases of distress land sales).
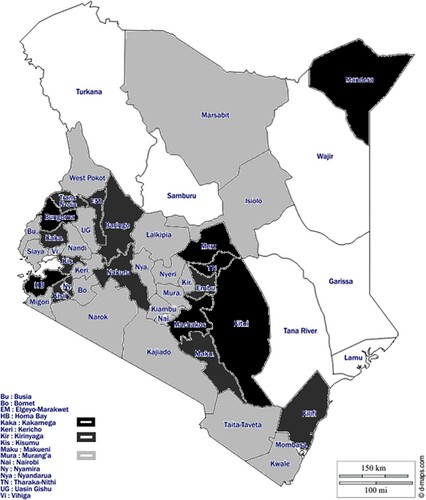
Figure 2. Concentration of households that sold farmland in response to shocks per county – 2015/2016 KIHBS (the color density represents the spread of cases of distress land sales).
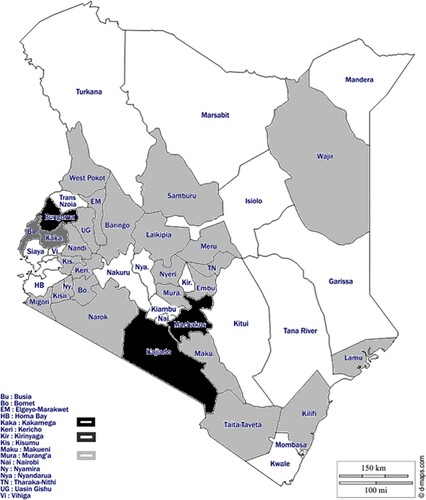
Table 1. Characteristics of shocks that led to distress sales of farmland.
Table 2. Characteristics of households (in districts and counties where land was sold).
Table 3. Shock characteristics influencing household decision to sell farmland as a coping mechanism (marginal effects).
Table 4. Household characteristics influencing decision to sell farmland as a coping mechanism (marginal effects).
Table A1. First coping option with shocks (using 2005/2006 KIHBS).
Table A2. Second coping option with shocks (using 2005/2006 KIHBS).
Table A3. Third coping option with shocks (using 2005/2006 KIHBS).
Table A4. First coping option with shocks (using 2015/2016 KIHBS).
Table A5. Second coping option with shocks (using 2015/2016 KIHBS).
Continued
Table A6. Third coping option with shocks (using 2015/2016 KIHBS).
Table A7. Size of the shocks (in monetary terms) and the incidence of distress sales of farmland (2005–2006 KIHBS).
Table A8: Size of the shocks (in monetary terms) and the incidence of distress sales of farmland (2015–2016 KIHBS).