
Figures & data
Figure 1. Environmental Kuznets curve model. Source: Adopted from Ngarava et al. (Citation2019).
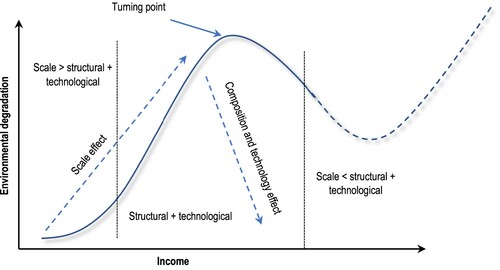
Table 1. Descriptive statistics for the period 1993–2020.
Figure 2. Tress index and CO2 emission in South Africa (1993–2020).
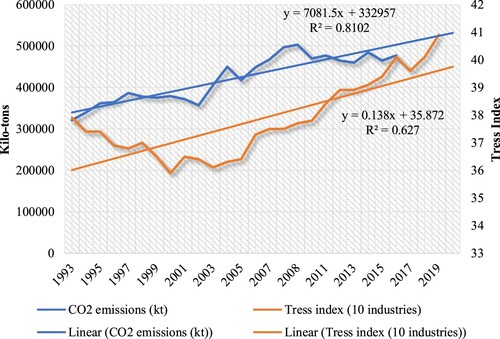
Figure 3. Provincial tress indices (10 industries) between 2000 and 2020 in South Africa.
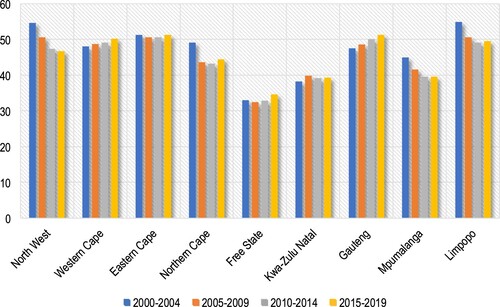
Table 2. Unit root test.
Table 3. Lag order selection criteria.
Table 4. ARDL Bounds Test.
Table 5. Long-run relationship.
Table 6. Error correction model regression.
Table 7. Pairwise Granger causality test.
Table 8. Diagnostic tests.