
Figures & data
Table 1. Proportion of income by source and livelihood.
Table 2. Summary statistics of included variables.
Figure 1. Monthly household income per capita by livelihood. Income measured in millions of Vietnamese Dong (VND).
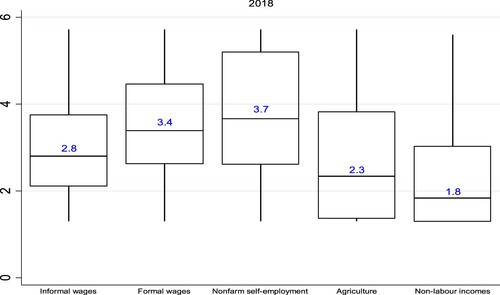
Table 3. Comparing household per capita income, by livelihood.
Table 4. Multinomial logit estimates for landlessness and livelihood choice in the Red River Delta, Vietnam (Relative Risk Ratios).
Figure 2. Predicted probabilities of choosing various livelihoods, by annual cropland owned.
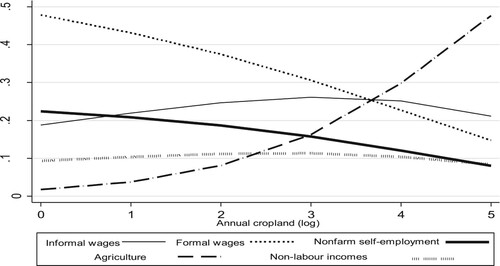
Figure 3. Predicted probabilities of choosing various livelihoods, by years of formal schooling.
