
Figures & data
Figure 1. Trends in education attainment.
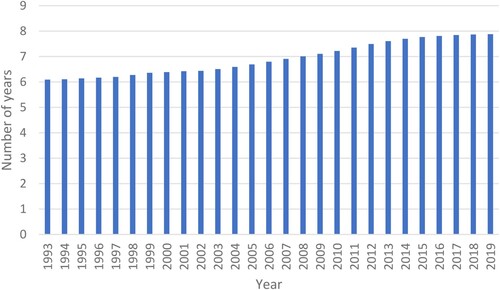
Figure 2. Average years of education attainment (1993–2019).
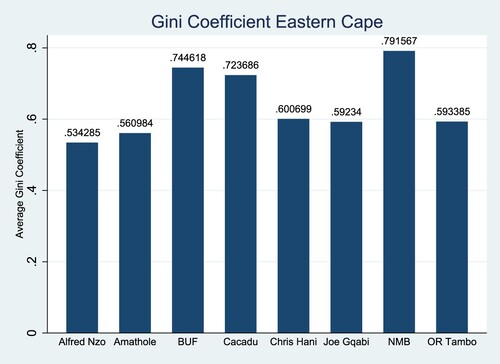
Figure 3. Average poverty levels (1996–2018).
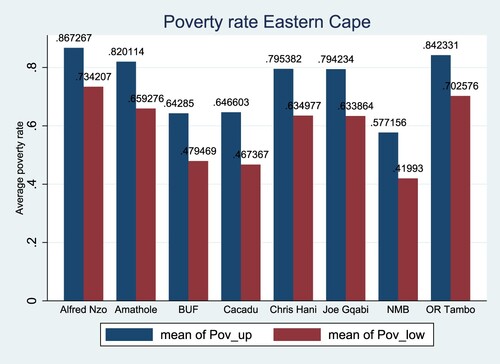
Figure 4. Average Gini coefficient (1993–2019).
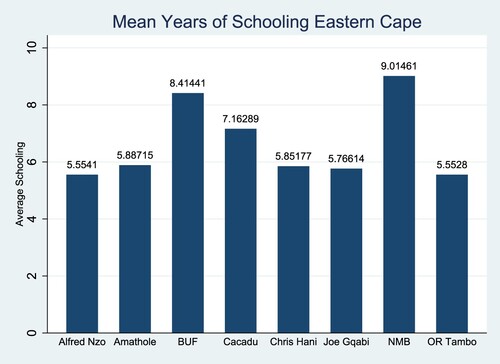
Table 1. Descriptive statistics.
Table 2. Cross-sectional dependence test.
Table 3. Pesaran (Citation2007) CIPS unit root test: Levels.
Table 4. Pesaran (Citation2007) CIPS unit root test: First difference.
Table 5. Empirical results.
Table 6. Robustness checks.