
Figures & data
Table 1. Methods for measuring inclusive economic growth.
Figure 1. Evaluation framework. References: Whiteford (Citation2017), Li et al. (Citation2021), Johnstone (Citation2022).
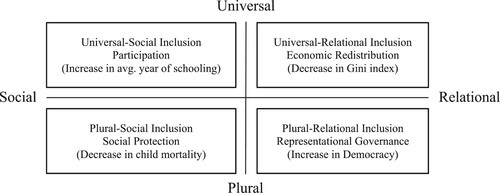
Table 2. Data definition and sources.
Table 3. Summary statistics of the data.
Table 4. Summary statistics of the iTFP estimation results.
Figure 2. Mapping results of the iTFP indexes.
Notes: The map is colored based on the TFP index in 2019. Source: Author’s calculations.
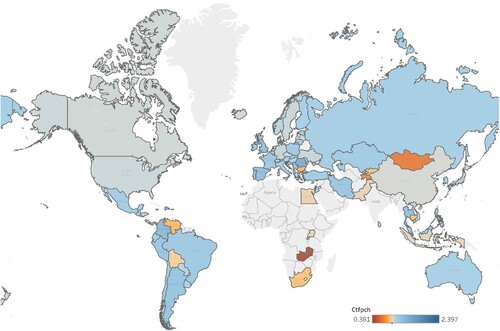
Table 5. Summary statistics of the iTFP estimation results, categorized by region.