
Figures & data
Figure 1. Provinces in Cambodia, Laos, and Vietnam where data collection took place.
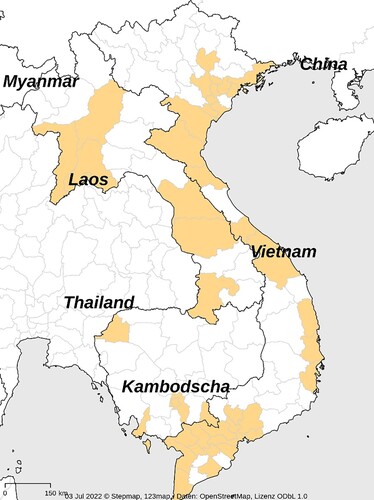
Table 1. Wage and employment growth, 2012–2017.
Figure 2. Median wage 2017, by occupational level. Source: Own survey. Logarithmic wage levels. Grey area: Minimum wage level in 2017.
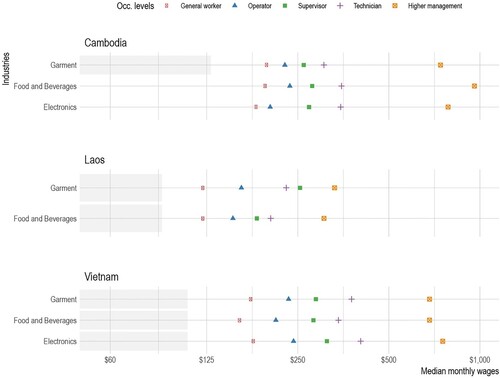
Figure 3. Median wage growth, by occupational level.
Source: Own survey. Note: F&B in Laos shows the same median growth for four of the five occupational levels. Seemingly, companies applied the same rule for wage increases across almost all occupational levels.
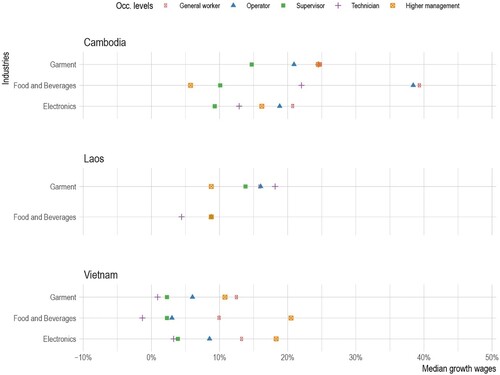
Table 2. Relative wage growth, 2012–2017.
Figure 4. Wage ratios 2017.
Source: Own survey.
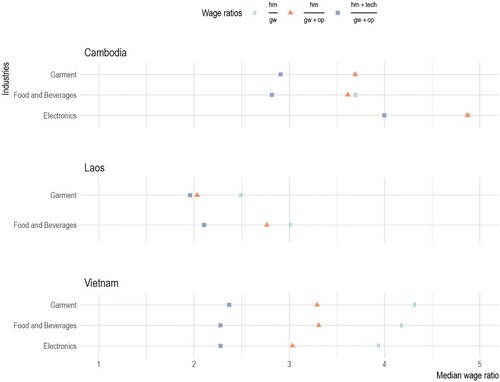
Figure 5. Change wage ratios 2012–2017.
Source: Own survey.
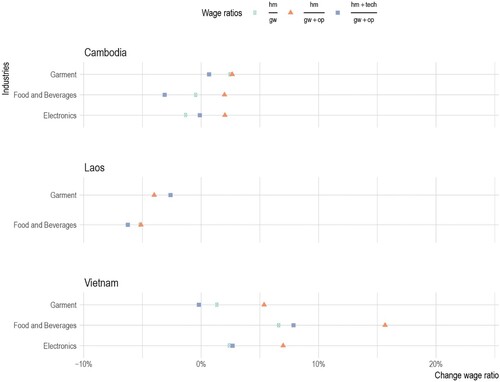
Figure 6. Wage growth and initial wage distribution for all countries.
Source: Own survey.
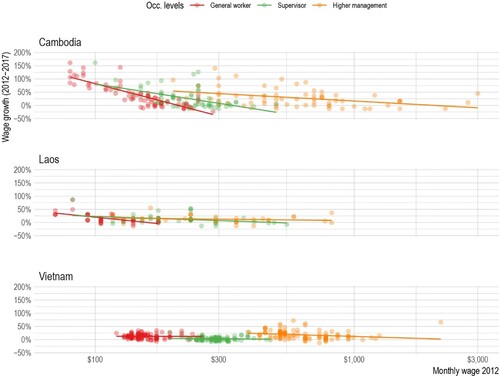
Figure 7. Wage growth and initial wage distribution for all industries.
Source: Own survey.
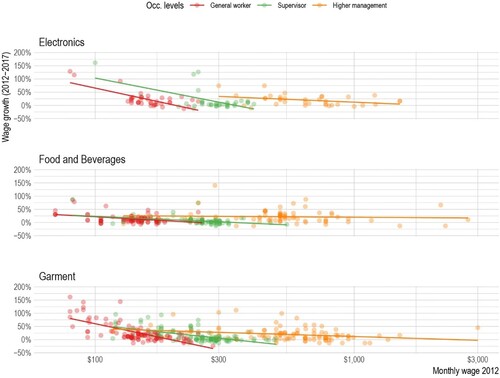
Table 3. Regression: explaining wage increase.