Figures & data
Figure 1. Components of the education sector. Source: Authors.
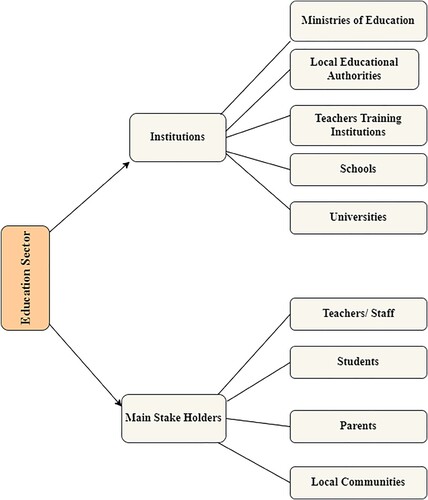
Figure 2. Populations affected by natural hazards by national income bracket: 1998–2017 (UNISDR Citation2017).
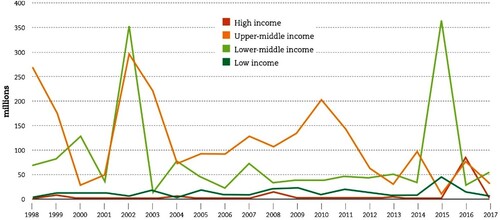
Figure 3. The PRISMA (Preferred Reporting Items for Systematic Reviews and Meta-analysis) Framework (Moher et al. Citation2009) was applied to this review study.
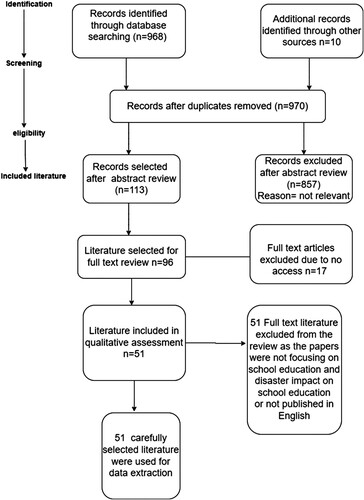
Table 1. Flood events and their impacts on the education system.
Table 2. Major cyclones and their impacts on the education system.
Table 3. Major Earthquakes and Tsunami and their impacts on the education system.
Table 4. Indicators of flood vulnerability assessment.
Table 5. Indicators for earthquake vulnerability assessment.
Table 6. Vulnerability indicators for cyclones.
Figure 4. The Pressure and Release Model. Source: Adapted from Dwiningrum, Prihastuti, and Suwarjo (Citation2019).
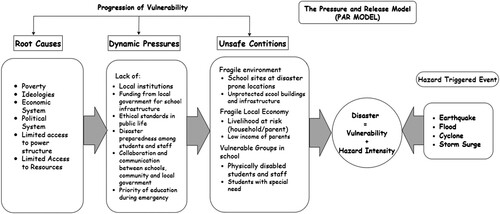
Table 7. Indicators for safe schools.
Figure 5. School disaster assessment indicators. Source: Adapted from Wang (Citation2020).
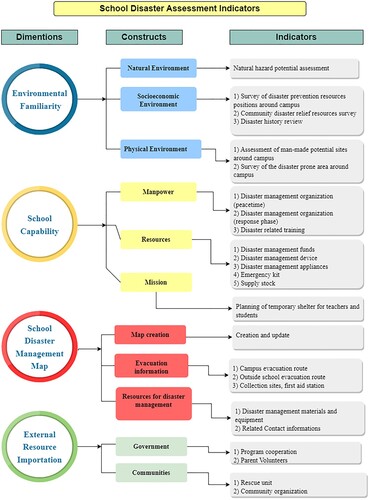
Figure 6. CSS Framework Concept for School Safety. Source: Modified from UNESCO (Citation2013).
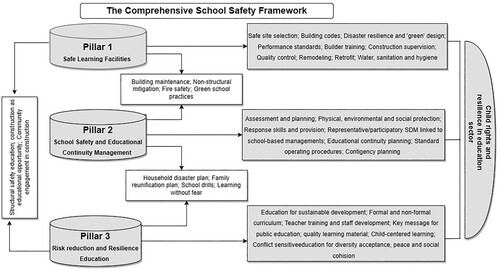
Table 8. Sendai Framework for Disaster Risk Reduction (SFDRR) 2015-2030: The four priorities for actions.
Figure 7. Flowchart explaining how education influences disaster preparedness and its interplay with disaster experience. Source: Hoffmann and Muttarak (Citation2017).
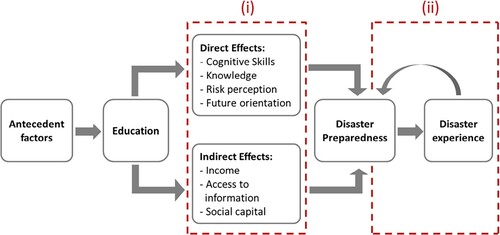
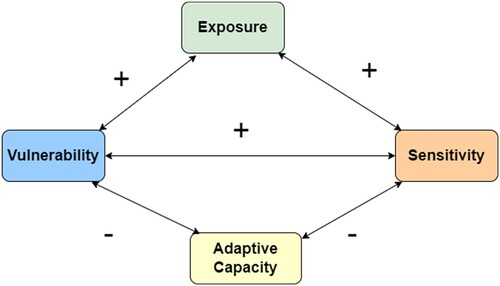
Figure 8. Feed-back Model: Components of vulnerability.