
Figures & data
Figure 1. Gini coefficient per average number of remittances.
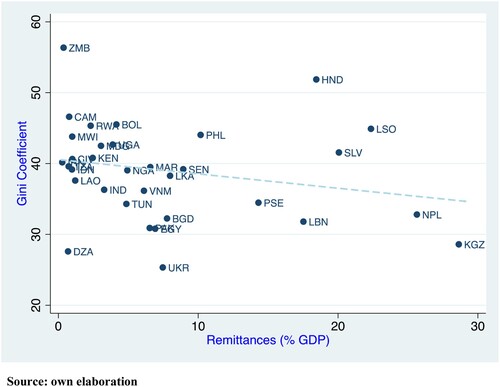
Figure 2. Gini coefficient per average cost of remitting.
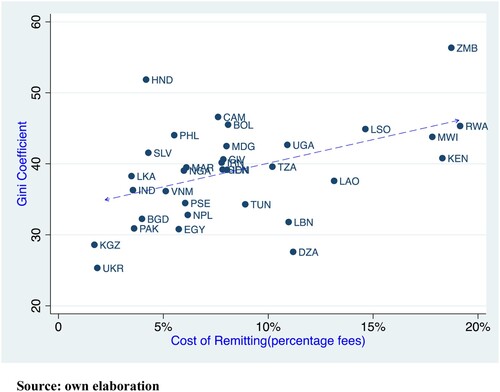
Figure 3. (a) Change in the cost vs Change in the amount remitted. (b) Change in the cost vs Change in the number of remittances.
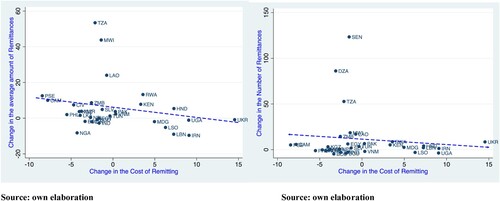
Table 1. Distributional effect of remittances: pooled OLS.
Table 2. First-stage instrument variable estimates for remittances.
Table 3. The role of cost of remitting in the distributional effect of recorded remittances (dependent variable: Gini coefficient).
Table 4. Robustness checks.
Table A1. List of countries by region.
Table A2. List of variables.
Table A3. Descriptive statistics.