Figures & data
Table 1. Blau’s index diversity categories.
Table 2. Percentage for rural-urban areas in terms of crime type.
Table 3. Descriptive statistics.
Table 4. Logistic regression result, marginal effect.
Table 5. OLS regression analysis results on crime by land use category.
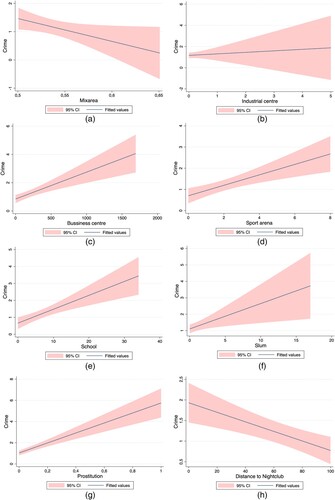
Figure 1. Graph two-way liftci on undiversified areas.
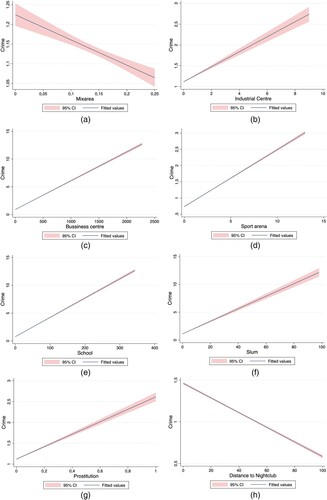
Figure 2. Graph two-way liftci on moderately diversified areas.
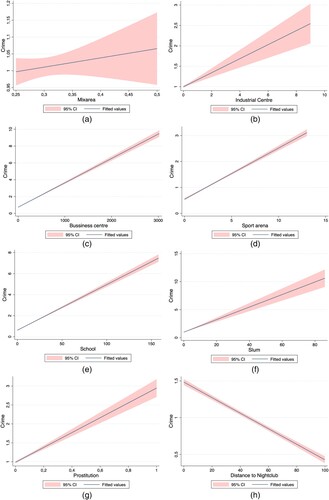
Figure 3. Graph two-way liftci on diversified areas.