
Figures & data
TABLE 1 Descriptive statistics for the independent and control variables
Figure 1 Mean number of online news sources used in the previous week
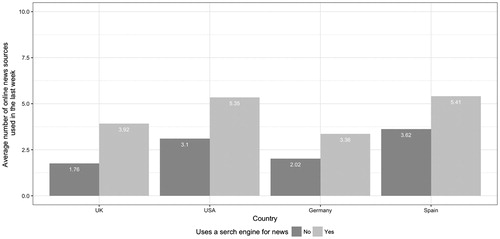
Figure 2 Proportion that used both a left-leaning and right-leaning online news source in the last week
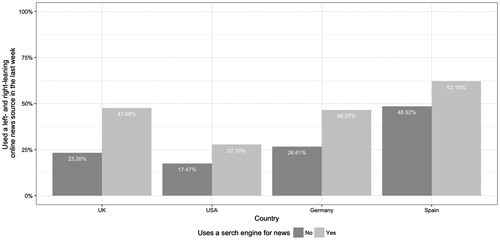
Figure 3 Mean ratio between left-leaning and right-leaning news sources used in the last week
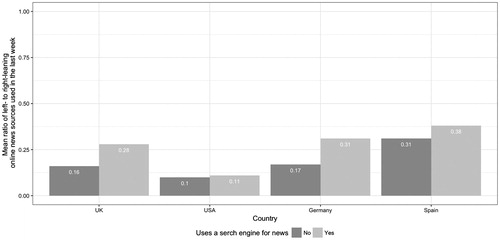
TABLE 2 Poisson regression models where the dependent variable is number of online news sources used in the last week
TABLE 3 Binary logistic regression models where the dependent variable is the proportion of people who used both a left-leaning and a right-leaning online news source in the last week
TABLE 4 Poisson regression models where the dependent variable is the ratio of left-leaning and right-leaning online news sources used in the last week