Figures & data
Table 1. Descriptive statistics of the sample.
Figure 1. Overview of the Experimental Design.
Note: This figure illustrates the experimental design. The box on the left shows a mock-up in English of the experiment as seen by the respondents; a shows how information about the recommender was presented, b the news story, c shows the question wording for reading, d sharing, e shows how a–d were randomly assigned between subjects, and f shows all the possible attributes and attribute values.
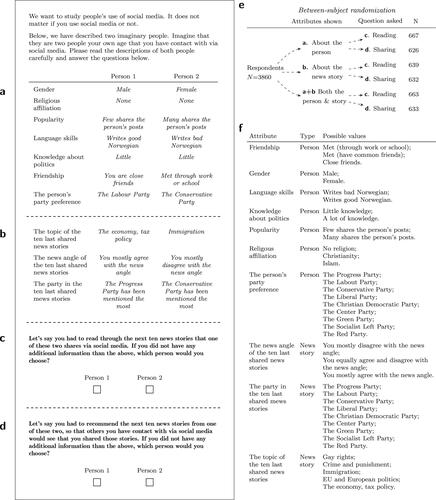
Figure 2. Comparing effects (AMCE) of attributes (news-story attributes) on probability to read vs. probability to share.
Note: The dots represent the point estimates, and the bars show 95 percent confidence intervals.
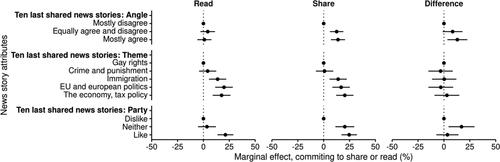
Figure 3. Comparing effects (AMCE) of attributes (recommender attributes) on probability to read vs. probability to share.
Note: The dots represent the point estimates, and the bars show 95 percent confidence intervals.
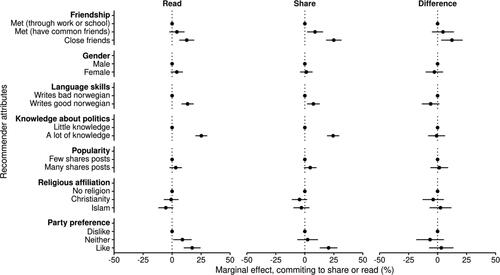
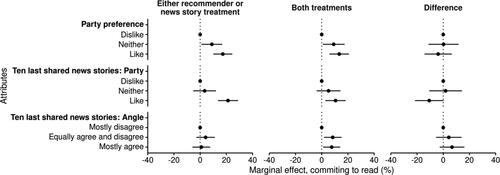
Figure 4. Moderation effects (conditional AMCEs) of attributes on profile selection (probability to share).
Note: The dots represent the point estimates, and the bars show 95 percent confidence intervals.
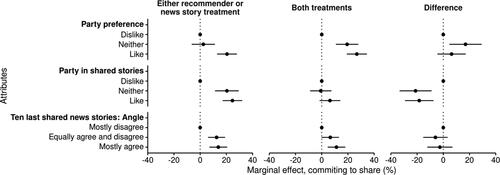
Figure 5. Moderation effects (conditional AMCEs) of attributes on profile selection (probability to read).
Note: The dots represent the point estimates, and the bars show 95 percent confidence intervals.