Figures & data
Figure 1. Degree of activity among different kinds of active subscription accounts, 2018 (per cent, mean, minutes, numbers).
Note: The share of active accounts among all accounts/week is 72 per cent among the long-term accounts, 79 per cent among the short-term accounts/older, and 57 per cent among the short-term accounts/younger. The analyses are based on all active accounts, not a selection of accounts. All subscribers with long-term accounts who also have a print subscription are excluded from the analysis. All page views are included independent of time spent, but for number of articles read, only visits longer than five seconds are included. In addition, the articles are counted only once per subscriber, even if they are read several times. The explanation for the higher number of visits on the start page in relation to the number of visits overall is that many readers navigate from the start page to the article, back to the start page, and to the next article, etc.
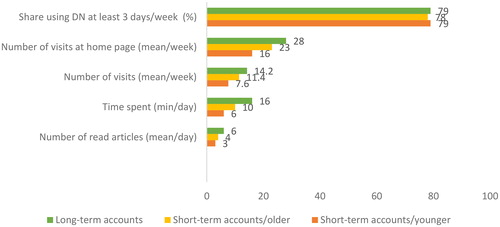
Table 1. Degree of activity on active short-term accounts/older during the free-of-charge period, 2018 (mean).
Figure 2. Share of total page views per editorial section among different kinds of active subscription accounts, 2018 (per cent).
Note: Only article page views—not the start page—are included in this analysis. Quizzes, etc. are excluded. All subscribers with long-term accounts who also have a print subscription are excluded from the analysis. The category “other” includes lifestyle, food and drink, insights, obituaries, and travel. The analyses are based on all active account, not a selection of accounts.
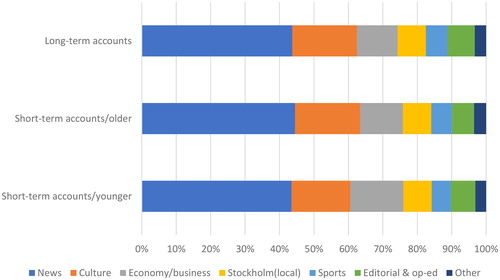
Table 2. Platforms used among different kinds of active subscription accounts, 2018 (per cent and number).
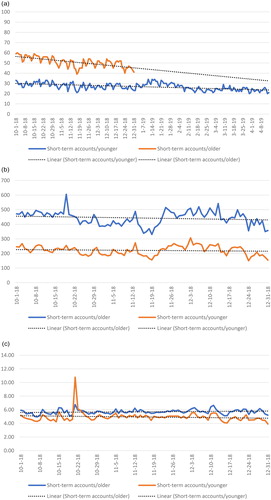
Figure 3. (a) Share of all accounts that are active per day on the DN website (desktop, tablet, mobile), among young and old subscribers with short-term accounts, 2018–2019 (per cent). (b) Average time spent per day per unique active accounts, among young and old subscribers with short-term accounts, 2018 (seconds). (c) Average number of articles read per day and unique active account, among young and old subscribers with short-term accounts, 2018 (number).
Note: The free subscription stopped by the turn of the year for the old subscribers with short-term accounts, while the young subscribers with short-term accounts had an offer for a whole year starting in summer 2018. The results are based on all active accounts, not a selection of accounts. Sum of time spent for all web pages (inclusive of the start page) are included in the analysis (desktop, tablet, mobile). Time measurement is not available in the app. The results are based on all active accounts, not a selection of accounts. All page views (except the start page) are included in this analysis. The results are based on all active accounts, not a selection of accounts.