
Figures & data
Table 1 Results of the hypothesized model.
Figure 1. Johnson–Neyman plot for the interaction of mainstream media use and alternative digital media use on political interest.
Note. T1 = Time 1. T2= Time 2.
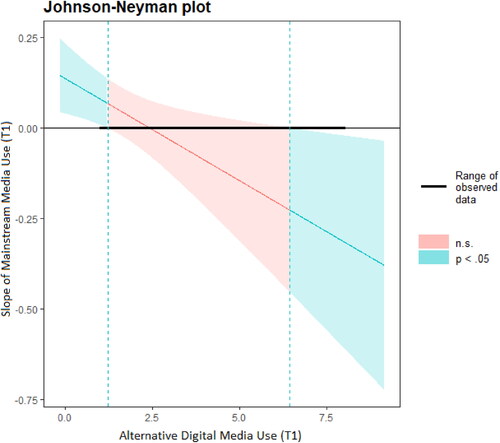
Table A1 Proofs of measurements for political knowledge.
Data Availability Statement
Data are available at https://osf.io/n7qpc/?view_only=16c164e221c1462180c0e5347cb6469d.