Figures & data
Table 1. Comparing affordances and logics across platforms.
Table 2. Study sample.
Table 3. Proportion of website articles shared across platforms.
Table 4. Proportion of social media posts excluding website links.
Figure 1. Effects of article-related characteristics on social media distribution.
Note: Binary logistic regression model with outlet-fixed effects (significant effects at p < .05 depicted in black). Average Marginal Effects (AME) indicate effects of independent variables on the probability of website articles (N = 2,654) being shared on each platform.
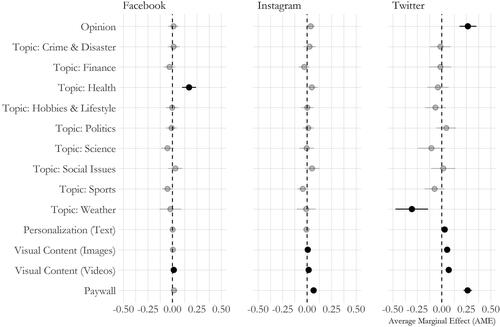
Figure 2. Differences in interactive features and engaging language between news websites and social media platforms.
Note: Linear regression with outlet-fixed effects (significant effects at p < .05 depicted in black). Marginal Means describes estimated differences when comparing website articles to social media posts.
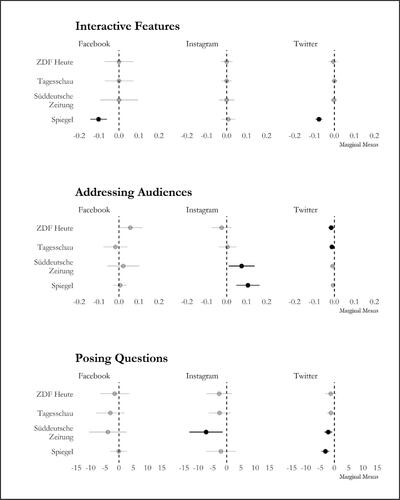
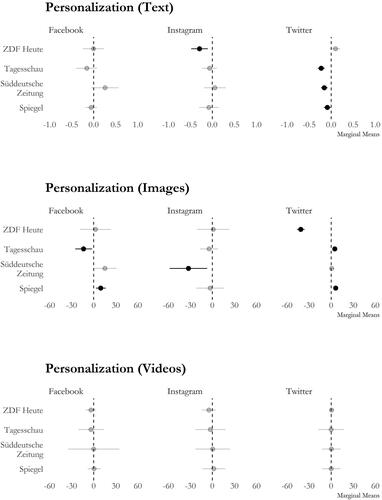
Figure 3. Differences in personalization between news websites and social media platforms.
Note: Linear regression with outlet-fixed effects (significant effects at p < .05 depicted in black). Marginal Means describes estimated differences when comparing website articles to social media posts.